Looker Studio Connector v2 [updated 3.27.26]
The v2 connector is built for agencies and multi-brand organizations. Connect all your brands to a single Looker Studio data source, compare visibility side by side, and optionally pull in agent traffic data — all without juggling separate connectors per brand.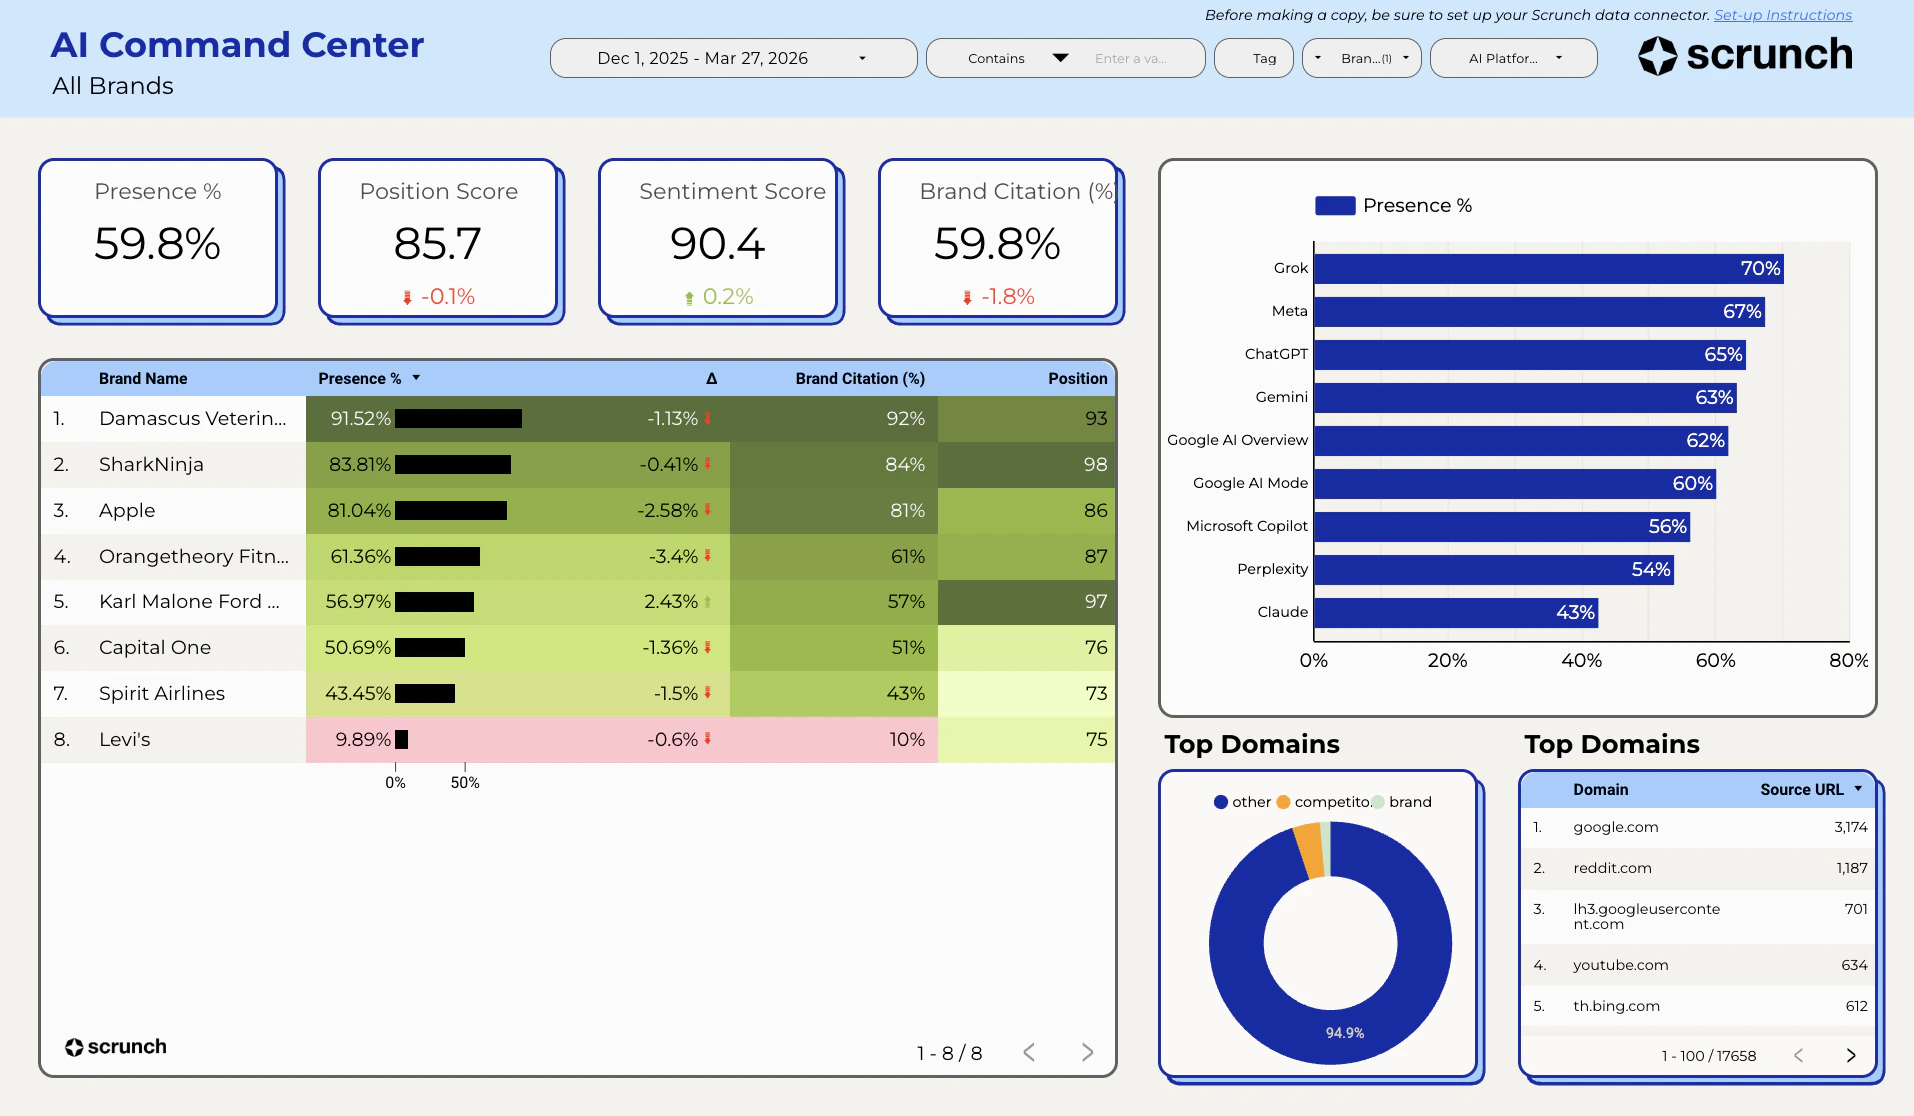
- Multi-brand support — connect 1 to 30+ brands in a single data source
- Agent Traffic data — see which AI bots are crawling your site, how often, and where
- Comparison fields — brand vs. competitor presence in a single chart
- Smarter caching and parallel fetching — faster dashboards, even at scale
Looking for the original single-brand connector? See the v1 Looker Studio guide.
Install the Connector
The connector is not yet in the public gallery. Install it directly using the link below:Install Connector
Open the Scrunch Looker Studio Connector
Configure Your Connection
When you open the connector, you’ll see a configuration screen with the following fields:Enter your API key
Paste your Scrunch API key. You can provision one from:Scrunch → Organization → Settings → API Keys
Enter your Brand IDs
Enter one or more brand IDs, separated by commas. For example:
46,47,48To find a brand ID, open the brand in Scrunch and look at the URL:https://app.scrunchai.com/org/.../b/1234/dashboardHere, 1234 is your Brand ID.(Optional) Enter a Site ID for Agent Traffic
If you want agent traffic data (which AI bots are crawling your site), enter your Site ID.Leave this blank if you only need AI visibility metrics (presence, position, sentiment).
You can find your Site ID in Scrunch → Brand → Agent Traffic → Settings. If you haven’t set up Agent Traffic yet, skip this for now.
(Optional) Set Time Bucket and Path Filter
These only apply to Agent Traffic data:
- Time Bucket — Choose
DayorWeekto control how traffic data is aggregated - Path Filter — Restrict results to a specific URL path (e.g.,
/blogto only see bot traffic to your blog)
Available Fields
The connector combines fields from two Scrunch APIs. Looker Studio automatically routes your chart to the right API based on which fields you use.Query API Dimensions
| Name | Type | Semantic Type | Notes |
|---|---|---|---|
brand_id | NUMBER | NUMBER | Numeric brand identifier |
brand_name | STRING | TEXT | Auto-resolved from Scrunch API |
date | STRING | YEAR_MONTH_DAY | |
date_month | STRING | YEAR_MONTH | |
date_week | STRING | YEAR_WEEK | |
prompt_id | NUMBER | NUMBER | |
prompt | STRING | TEXT | |
source_url | STRING | URL | |
source_type | STRING | TEXT | Brand, Competitor, Other |
persona_id | NUMBER | NUMBER | |
persona_name | STRING | TEXT | |
competitor_id | NUMBER | NUMBER | |
competitor_name | STRING | TEXT | |
ai_platform | STRING | TEXT | ChatGPT, Perplexity, Google AI Overviews, Meta, Claude |
ai_platform_search_enabled | BOOLEAN | BOOLEAN | |
tag | STRING | TEXT | |
branded | BOOLEAN | BOOLEAN | Whether the prompt includes brand name(s) |
stage | STRING | TEXT | |
prompt_topic | STRING | TEXT | |
country | STRING | TEXT |
Query API Metrics
| Name | Type | Semantic Type | Notes |
|---|---|---|---|
responses | NUMBER | NUMBER | Count of AI responses |
brand_presence_percentage | NUMBER | PERCENT | |
brand_citation_percentage | NUMBER | PERCENT | Alias for brand_presence_percentage |
brand_position_score | NUMBER | NUMBER | Range: 1-100 |
brand_sentiment_score | NUMBER | NUMBER | Range: 1-100 |
competitor_presence_percentage | NUMBER | PERCENT | Requires a competitor dimension |
Comparison Fields
These virtual fields let you compare brand and competitor presence in a single chart. When you addentity_name as a breakdown dimension, the connector automatically splits each row into a brand row and a competitor row.
| Name | Type | Semantic Type | Notes |
|---|---|---|---|
entity_name | STRING | TEXT | Brand name or competitor name |
entity_type | STRING | TEXT | ”Brand” or “Competitor” — use to filter or color-code |
presence_percentage | NUMBER | PERCENT | Unified presence metric (brand or competitor depending on entity) |
Agent Traffic Dimensions
These fields are only available when a Site ID is configured.| Name | Type | Semantic Type | Notes |
|---|---|---|---|
date | STRING | YEAR_MONTH_DAY | Agent Traffic only supports daily granularity |
site | STRING | TEXT | The site being crawled |
path | STRING | TEXT | URL path |
agent_source | STRING | TEXT | Bot identifier (e.g., GPTBot, ClaudeBot) |
agent_type | STRING | TEXT | Category of agent |
Agent Traffic Metrics
| Name | Type | Semantic Type | Notes |
|---|---|---|---|
agent_requests | NUMBER | NUMBER | Number of requests |
Using the Looker Studio Template
To get started quickly, copy our pre-built template and connect it to your data source.Install the connector first
Make sure you’ve already installed and configured the v2 connector using the link above.
Make a copy
In the top-right corner, click the three dots → Make a copy.When prompted, select the Scrunch v2 data source you configured earlier.
Multi-Brand Dashboards
The v2 connector is designed for comparing brands side by side. Here are some tips:- Use
brand_nameas a dimension to break down any metric by brand - Use
brand_idfor filtering when you want to isolate a specific brand in a chart - Comparison fields (
entity_name,entity_type,presence_percentage) work per-brand — each brand’s competitors are included automatically
Brand names are automatically resolved from your Scrunch organization. If you see numeric IDs instead of names, make sure your API key has access to the brands you’ve configured.
FAQs
Can I use this with just one brand?Yes. Enter a single Brand ID and the connector works exactly like the v1 connector, with the added benefit of comparison fields and agent traffic support.What happens if I mix Query API and Agent Traffic fields?
The connector will show an error message explaining that you need to use separate charts. This is by design — the two APIs return different row structures that can’t be combined in a single table.Does Agent Traffic support weekly or monthly date grouping?
Agent Traffic only supports theHow do I compare last week vs. previous week?datedimension (daily granularity). If you need weekly aggregation, use thetime_bucketconfiguration parameter set to “Week” — this tells the API to aggregate at the week level. Thedate_weekanddate_monthdimensions from the Query API are not available for Agent Traffic charts.
Use Looker Studio’s built-in date comparison feature, or create calculated fields:Are there limits to dashboard size?
Looker Studio allows a maximum of 30 concurrent Community Connector queries. The v2 connector uses intelligent caching and request deduplication, so multiple charts requesting the same data won’t each trigger separate API calls. In practice, this means you can build larger dashboards than with the v1 connector.
Resetting Your Connector
If something goes wrong, here’s how to start fresh:Open Data Sources
Go to Looker Studio and click Data Sources in the top navigation.
Revoke the connector
Click + Create → Data source → find the Scrunch connector under Partner Connectors → click the three dots → Revoke.
Reinstall
Use the connector install link to start fresh.
Summary
Multi-Brand Reporting
Connect all your brands in one data source. Compare visibility, position, and sentiment across your portfolio.
Agent Traffic Analytics
See which AI bots are crawling your site, how often, and which pages they visit.
Brand vs. Competitor
Use comparison fields to visualize brand and competitor presence side by side in a single chart.