Data Studio Connector (v2)
The v2 connector is built for agencies and multi-brand organizations. Connect all your brands to a single Looker Studio data source, compare visibility side by side, and optionally pull in agent traffic data — all without juggling separate connectors per brand.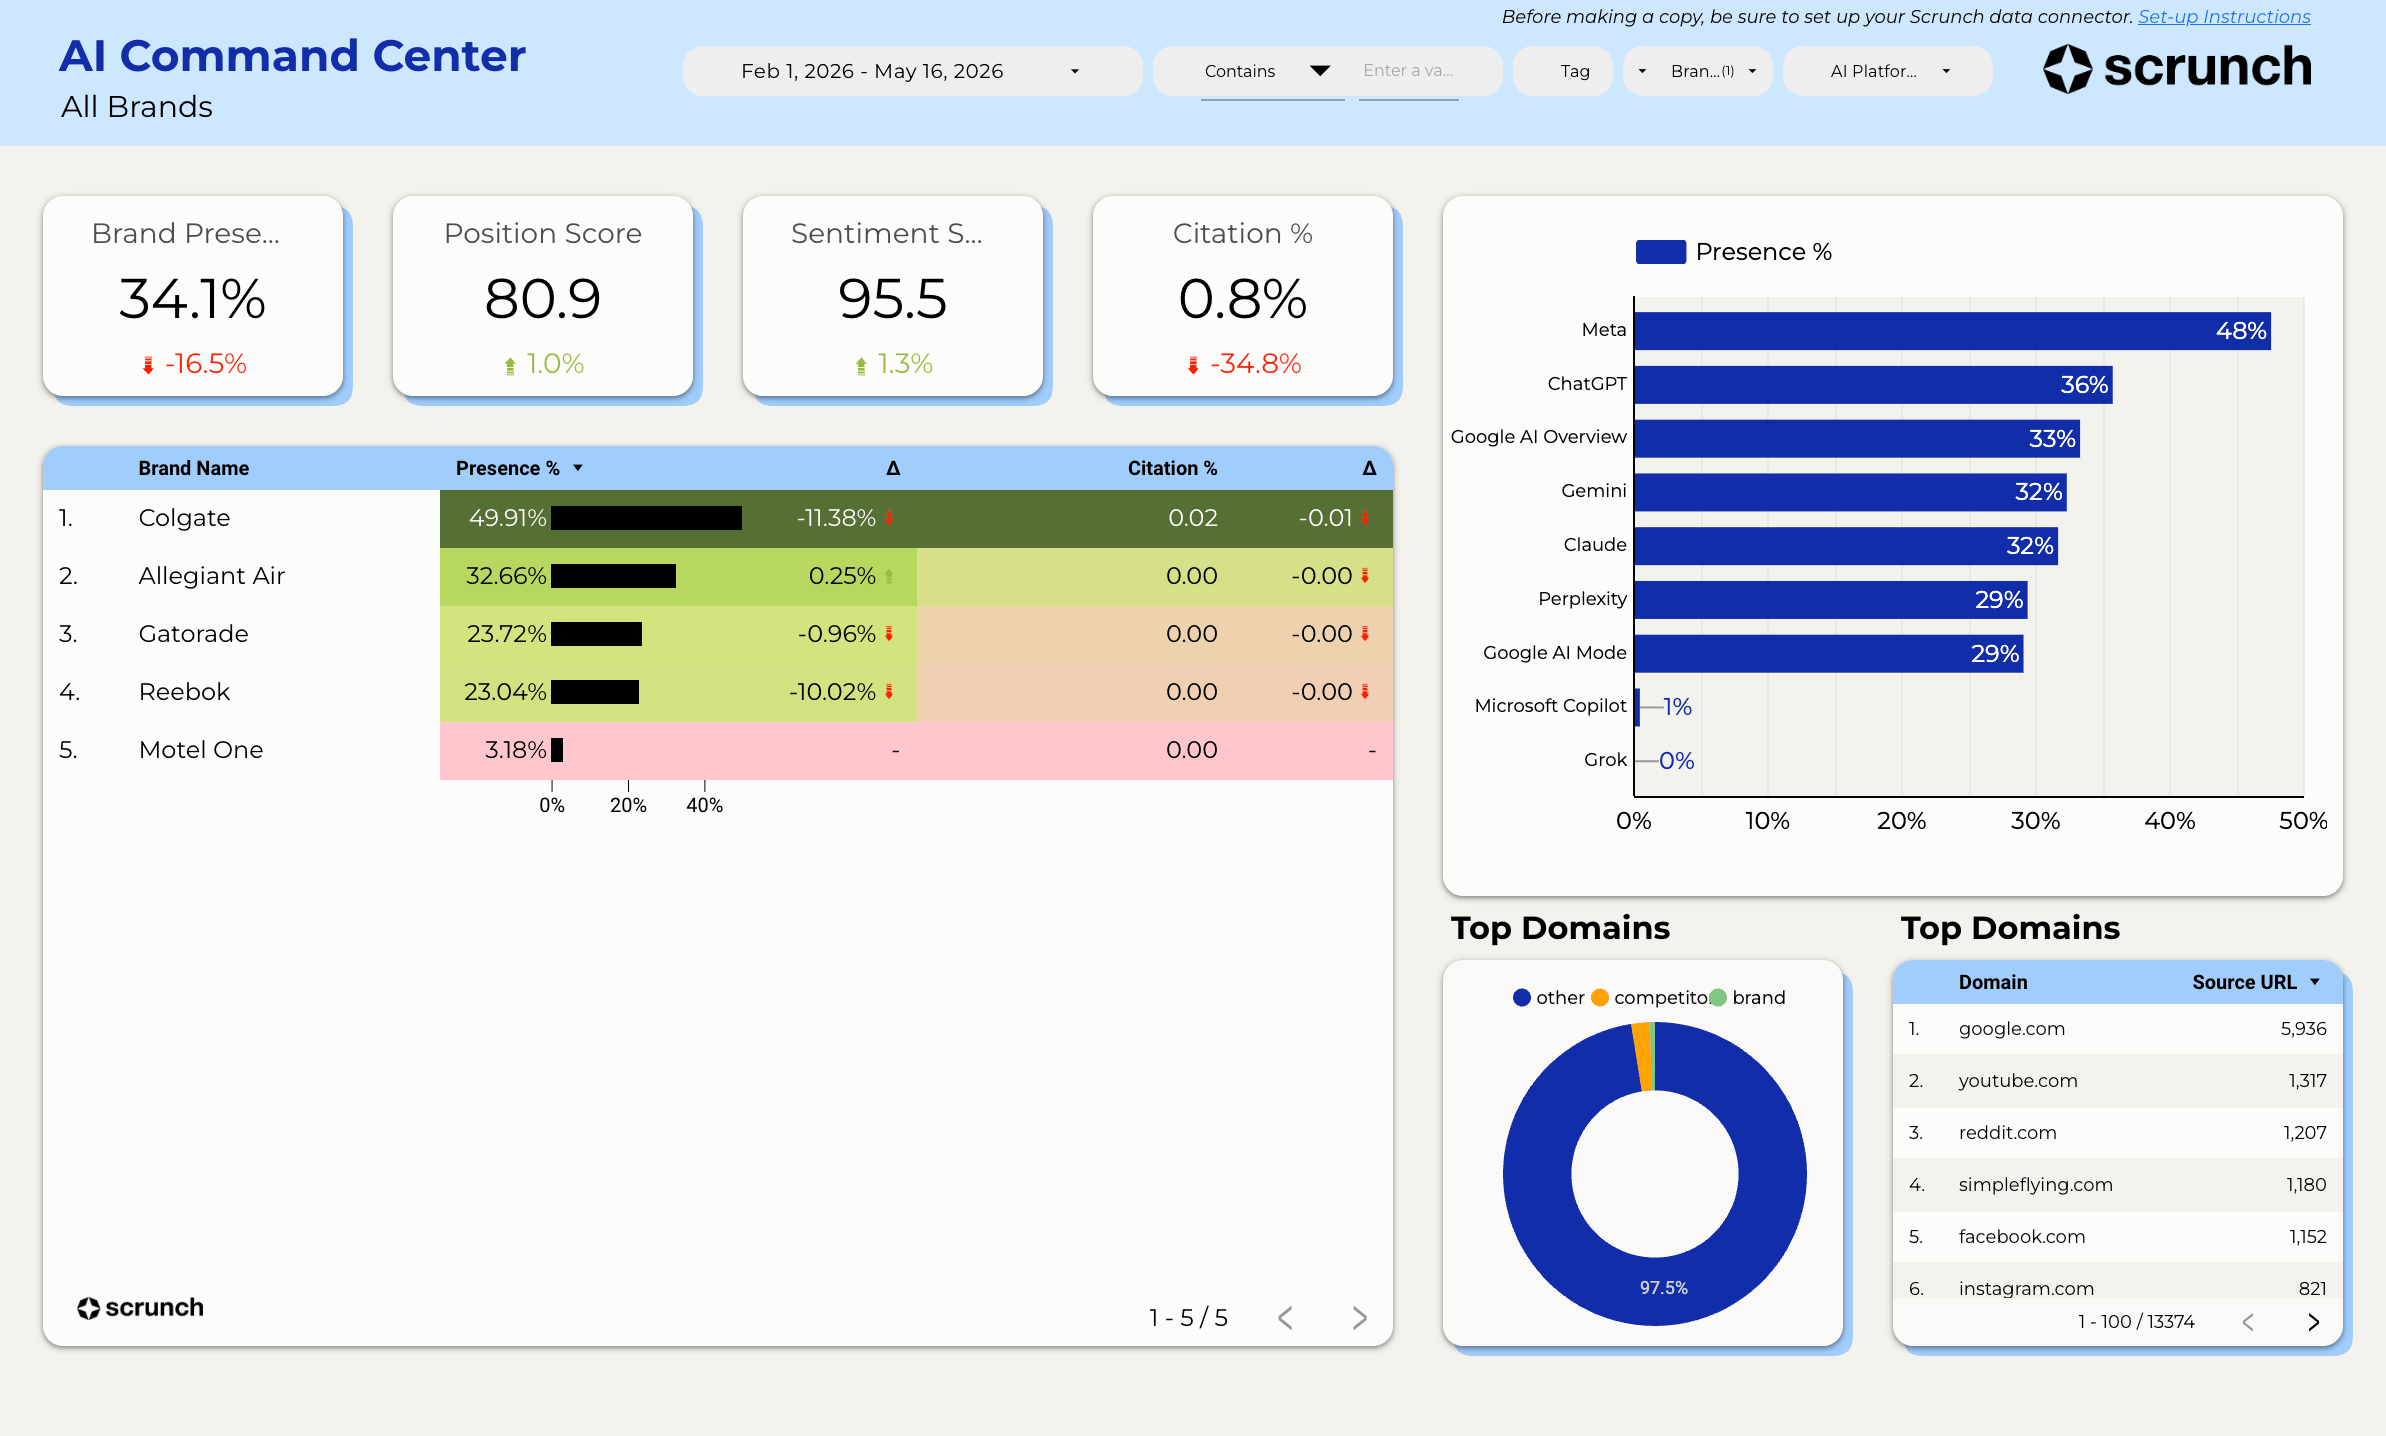
- Multi-brand support — connect 1 to 30+ brands in a single data source
- Agent Traffic data — see which AI bots are crawling your site, how often, and where
- Comparison fields — brand vs. competitor presence in a single chart
- Smarter caching and parallel fetching — faster dashboards, even at scale
Looking for the original single-brand connector? See the v1 Looker Studio guide.
Install the Scrunch Data Connector
The connector is not yet in the public gallery. Install it directly using the link below:Install Connector
Open the Scrunch Data Studio Connector
Configure Your Connection
When you open the connector, you’ll see a configuration screen with the following fields:1
Enter your API key
Paste your Scrunch API key. You can provision one from:Scrunch → Organization → Settings → API Keys
2
Enter your Brand IDs
Enter one or more brand IDs, separated by commas. For example:
46,47,48To find a brand ID, open the brand in Scrunch and look at the URL:https://app.scrunchai.com/org/.../b/1234/dashboardHere, 1234 is your Brand ID.3
(Optional) Enter a Site ID for Agent Traffic
If you want agent traffic data (which AI bots are crawling your site), enter your Site ID.Leave this blank if you only need AI visibility metrics (presence, position, sentiment).
You can find your Site ID in Scrunch → Brand → Agent Traffic. The Site ID can be quickly found in the URL → https://app.scrunchai.com/org/ … /sites/{site_id}
If you haven’t set up Agent Traffic yet, skip this for now.
If you haven’t set up Agent Traffic yet, skip this for now.
4
(Optional) Set a Path Filter
Restrict agent traffic results to a specific URL path prefix (e.g.,
/blog to only see bot traffic to your blog). Leave blank to include all paths.Time bucketing is automatic — the connector picks daily or weekly aggregation based on whichever date dimension you put on the chart (
Date for daily, Date Week for weekly). You don’t need to configure it.5
Connect
Click Connect in the top right. Data Studio will load the schema and you’re ready to build.
Available Fields
The connector combines fields from two Scrunch APIs. Data Studio automatically routes your chart to the right API based on which fields you use.Query API Dimensions
Query API Metrics
Looking for a brand citation rate? The dedicated field was removed because it duplicated
brand_presence_percentage. To compute the true share of responses where your brand appears as a source URL, see How to track brand citation rate in the troubleshooting guide.Comparison Fields
These virtual fields let you compare brand and competitor presence in a single chart. When you addentity_name as a breakdown dimension, the connector automatically splits each row into a brand row and a competitor row.
Agent Traffic Dimensions
These fields are only available when a Site ID is configured.Monthly aggregation isn’t available for agent traffic data yet. Use
Date Week for the closest equivalent.Agent Traffic Metrics
Multi-Brand Dashboards
The v2 connector is designed for comparing brands side by side. Here are some tips:- Use
brand_nameas a dimension to break down any metric by brand - Use
brand_idfor filtering when you want to isolate a specific brand in a chart - Comparison fields (
entity_name,entity_type,presence_percentage) work per-brand — each brand’s competitors are included automatically
Brand names are automatically resolved from your Scrunch organization. If you see numeric IDs instead of names, make sure your API key has access to the brands you’ve configured.