Troubleshooting
This page covers the issues we hear about most often when customers connect Scrunch data to Looker Studio (formerly Data Studio). It’s written for marketing teams, not engineers — but every section ends with enough detail to share with a developer or paste into an AI assistant if you get stuck. If you hit an error inside a chart, the message itself tells you what to do. Each one ends with a “Diagnostic details” line you can copy and share with support or paste into Claude / ChatGPT to get more help.When a chart shows an error message
The connector now surfaces real errors directly inside your chart instead of silently showing “No data.” Match the message you’re seeing to the right section below.404, invalid values, or wrong brand data
Error examples“We couldn’t load your agent traffic data right now…”
You may see one or more of the following errors in a Scrunch Looker Studio report:
Exception: Request failed for https://looker-api.scrunchai.com returned code 404
You may also see references like:getBrandData:236orgetData:194
Or chart-level errors such as:Invalid values
What this usually means
This usually means Looker Studio is trying to request Scrunch data for a Brand ID that the connector cannot retrieve.
Common causes include:This is usually a data source / connector configuration issue as opposed to a chart design issue.
- The data source is configured with the wrong default Brand ID.
- The Brand ID parameter override in the report is missing, invalid, or no longer allowed.
- The API key was deleted, regenerated, or rescoped through Scrunch (see here).
- A copied report is still pointing to a previous client’s data source or Brand ID.
- The connector was reconnected and the report-level or chart-level Brand ID overrides were invalidated.
How to fix
The person fixing this needs edit access to the Data/Looker Studio data source, not just the report.
- Open the affected Data Studio report.
- Identify the Scrunch AI data source used by the broken charts.
- Open the Scrunch AI data source.
- Go to
Edit connection.- Confirm that the API key is valid.
- Confirm that the Brand ID(s) are correct.
- Confirm that the API key is scoped to Query and has access to the intended brand through Scrunch.
- If the report relies on report-level, page-level, group-level, or chart-level Brand ID overrides, make sure
Allow "Brand IDs" to be modified in reportsis checked.- Click
Reconnect.Why Brand ID configuration matters
The Scrunch Looker Studio connector pulls data for a specific Scrunch brand. During connector setup, users are prompted to enter a Brand ID, and the current connector supports pulling data for one brand at a time.
Scrunch API tokens can be scoped to one or more brands or to an organization, but almost all API calls require a specific Brand ID. The Query API is the API used for reporting and BI workflows.
Data/Looker Studio Community Connectors can expose overridable parameters. If the connector allows a parameter to be modified in reports, editors can override the default value at the report, page, group, chart, or control level.

This means Scrunch’s Agent Traffic API returned an error for the brand(s) on this chart. Usually short-lived. Try in this order:“This chart is grouping agent traffic by Path / Agent Source across a date range that’s too big…”If you keep seeing this on every refresh for the same brand even with a short date range, check whether the brand’s Site ID is correct (see Agent traffic charts won’t load at all).
- Wait about a minute and refresh the chart. Many of these errors clear on their own.
- If the chart breaks down data by
PathorAgent Source, shorten the date range. Try 1 to 3 days. For high-traffic brands, those breakdowns become slow to aggregate over long ranges and can time out.- Use the connector’s
Path Filtersetting to narrow the chart to a single section of your site like/blog/. (See How to edit a data source connection below.)
This is the same kind of error as above, but the connector recognized that you’re using a Path or Agent Source breakdown and tailored its suggestions:“We couldn’t load your AI visibility data right now…”
- Shorten the date range. This is the fastest fix. Try 1-3 days first; expand from there. We’ve confirmed a chart breaking down ~21,000 daily agent requests by Path loads cleanly at 1 day but times out at 7 days.
- Add a
Path Filterto scope the chart to a section. Combines well with #1.- Split one large chart into several smaller ones, each filtered to a different section.
Same idea as the agent traffic error, but for the Query API (brand presence, citations, sentiment, etc.). Wait a minute, refresh, and if it persists, the diagnostic line in the message includes the brand ID and HTTP status — share that with support.“This chart is asking for two kinds of data at once…”
You’ve mixed brand visibility metrics (“Agent traffic data isn’t available by month yet”Brand Presence,Brand Sentiment, etc.) with agent traffic metrics (Agent Requests,Agent Source, etc.) in the same chart. These come from different parts of Scrunch and can’t share a chart. Fix: Build a separate chart for each kind of data. One chart for the visibility metric, a second chart for the agent traffic metric.
The Agent Traffic API supports daily and weekly aggregation, but not monthly. Fix: Change the chart’s date dimension to“This data source doesn’t have a Scrunch API key yet”Date Week(weekly) orDate(daily).
Click the pencil icon next to the data source in Looker Studio (or Edit connection), paste your Scrunch API key, and save. You can find your key at: app.scrunchai.com → Organization → Settings → API Keys.“This data source needs at least one brand ID”
Same fix path — click the pencil, then add brand IDs. Separate multiple with commas (e.g.,“This chart uses agent traffic data, but the data source doesn’t have a Site ID yet”1234,5678,9012). A brand’s ID is the number after/b/in its Scrunch URL — e.g.,1234inapp.scrunchai.com/org/.../b/1234/dashboard.
See Agent traffic charts won’t load at all below.
Charts say “No data” with no error message
If the chart isn’t showing an error, the connector got a successful response — there’s just no data to display. Common causes: The date range is outside the last 90 daysScrunch’s Query API only returns data for the last 90 days. If your report’s date range starts further back than that, your visibility charts will be empty.The chart filter is too restrictive
- Fix: Set the report or chart date range to a window within the last 90 days. The built-in “Last 30 days” / “Last 90 days” presets work well.
A branded = false filter, a competitor that wasn’t tracked during the date range, or a tag that doesn’t exist will all return zero rows.
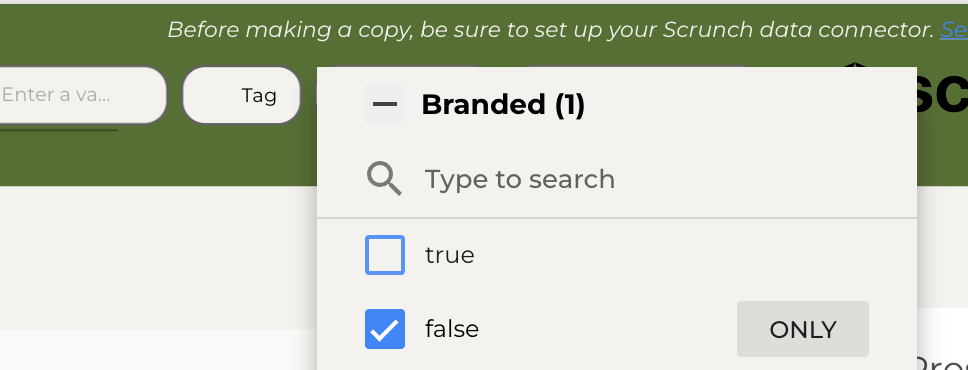
By default, the Scrunch dashboard filters to non-branded prompts. If you set up a chart with the same filter and your figure in the Scrunch app includes branded prompts (or vice versa), the numbers will look different.The chart’s per-chart data source is wrong
- Fix: Add a
Brandedfilter to the chart and set it to match what you want —falsefor non-branded only,truefor branded only, or remove the filter to include both.
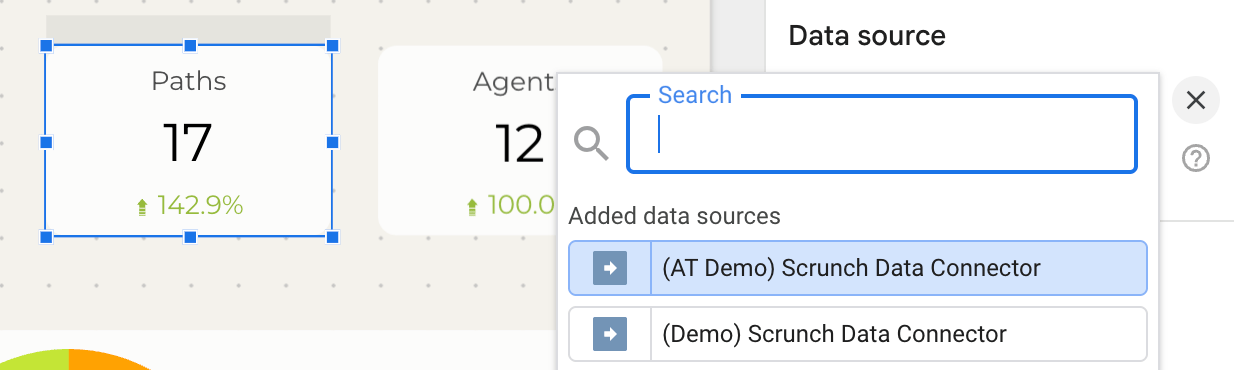
Looker Studio lets every chart override the report-level data source. If a chart was copied from a template, its per-chart data source might still point to the original (broken) connector, even though you’ve already set the report-level data source correctly.
- Fix: Click the chart → look in the right-hand panel under Setup → Data source. If it shows anything other than your Scrunch data source, click it and swap.
Agent traffic charts won’t load at all
Agent traffic charts need three things to work:The first two errors above are caught and shown clearly. The third one — Site ID — is also surfaced as an error now, but if you’re seeing empty charts after configuring a Site ID, double-check the value. Where to find a Site ID:
- A valid API key on the data source.
- One or more brand IDs that your API key can read.
- A Site ID for each brand whose agent traffic you want to chart.
The Site ID must belong to a brand your API key can access. If you have multiple brands, you currently configure one Site ID per data source — if you need agent traffic for multiple brands in one report, create a second data source for each.
- Open the brand in Scrunch.
- Navigate to Agent Traffic.
- Look in the URL — the Site ID is the long string after
/site/(e.g.,01KCHAEBS552AC5G1Z454E1AG2).- Paste it into the data source’s Site ID field.
After making a copy of a template
When you copy a Scrunch Looker Studio template into your own account, you’ll see one or more data sources labeled Unknown under the report. That’s expected — Looker Studio can’t share the original Scrunch data source across accounts, so it shows the placeholder until you swap in your own connection. Fix:Some templates have per-chart data sources in addition to the report-level one. After fixing the report-level data source, check a few charts — if they still show “Unknown” or “No data,” edit the chart and update its data source the same way (see The chart’s per-chart data source is wrong).
- Open the copied report.
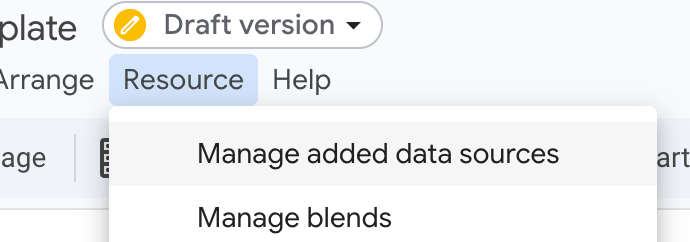
- Click Resource → Manage added data sources.
- For each “Unknown” entry, click Edit → Looker will prompt you to pick a replacement. Choose your Scrunch data source.
- Save.
How to track brand citation rate
Brand Citation (%)was removed from the connector because it was an alias forBrand Presence (%)— two fields with identical values was confusing more than helping. If you want a true citation rate (percentage of responses where your brand shows up as a source URL), build a calculated field in Looker Studio:Use it in a chart withSource Typeas a hidden filter or aggregate it across all rows for a single percentage. Set the metric type to Percent so Looker formats it correctly.
A chart loads partly, then stops
This happens on charts pulling lots of data. Looker Studio gives the connector a fixed time budget per chart; if it runs out before all the rows arrive, the chart can render partially or skip the rest. What works:
- Set a custom date range on the chart that’s narrower than the report’s range. Smaller fetch, completes in time, gets cached.
- Refresh the report. The first attempt may have failed; subsequent attempts read from cache and finish.
- Avoid combining several high-cardinality breakdowns in one chart (e.g.
Path+Agent Source+Datetogether). Pick one breakdown and use filters to narrow the others.
Why the same chart errored a minute ago and is error-free now (or vice versa)
When the connector hits an API error for a specific brand, it remembers that failure for 60 seconds and returns the cached error instantly for any chart that asks for the same data during that window. This protects Scrunch’s API from being hammered while it recovers and gives you fast feedback that something is still wrong. After 60 seconds, the connector tries again. If the underlying issue cleared, the chart loads normally. If not, you’ll see the same error message. This is why hitting refresh repeatedly during an outage looks like nothing is happening — you’re hitting the cached error each time. Wait a full minute between refreshes for the connector to retry.
How to edit a data source connection
If an error message tells you to “edit the data source,” here’s the path in Data/Looker Studio:1
Open the report in edit mode
Click Edit in the top right corner.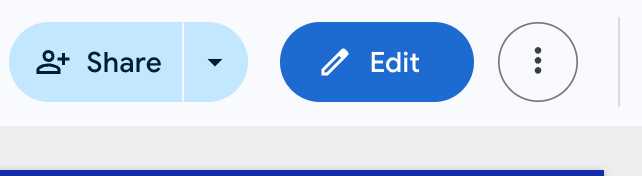
2
Open the data sources panel
Click Resource → Manage added data sources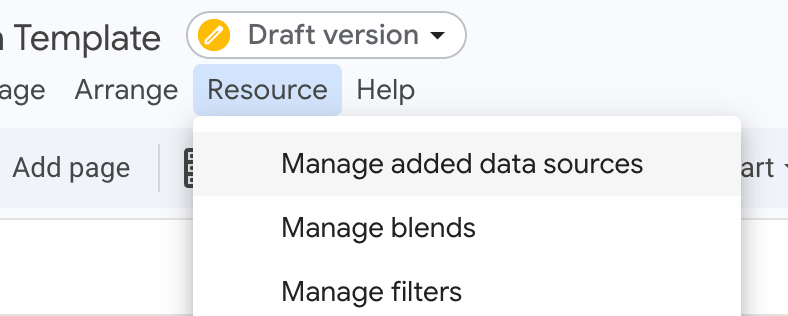
3
Edit the Scrunch data source
Find your Scrunch data source in the list and click Edit on the right.
4
Update connection settings
The connector configuration screen opens. Update the API Key, Brand IDs, Site ID, or Path Filter as needed, then click Reconnect in the top right.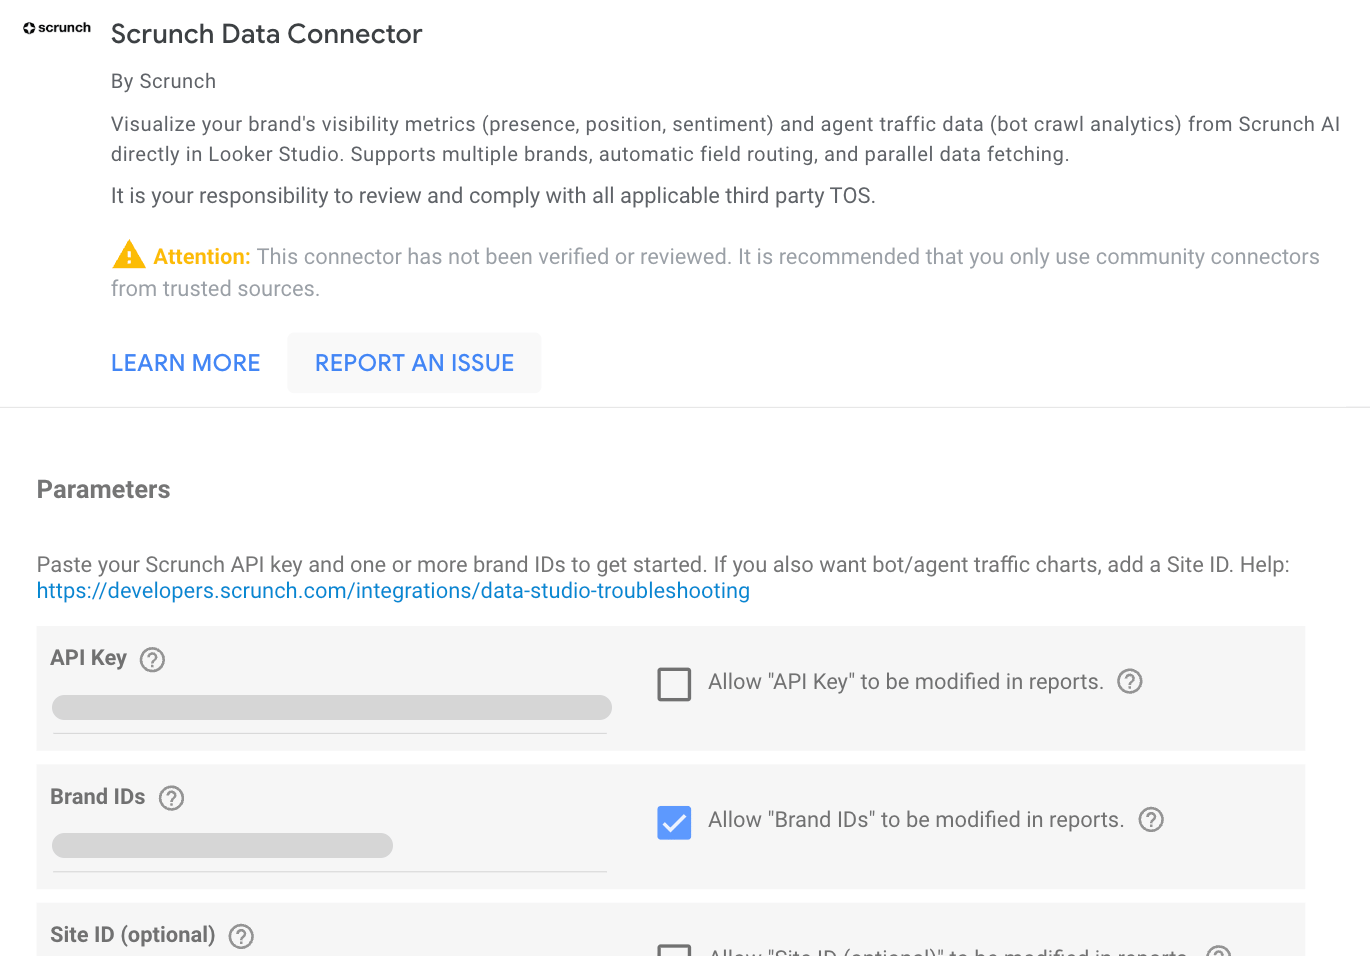
5
Apply changes
When prompted, click Apply to push the updated configuration to all charts using this data source.
How to read the diagnostic details in an error message
Every connector error ends with aDiagnostic details for reference: block. The pieces:
API="…"— which Scrunch API failed ("Query API"or"Agent Traffic API")brand=…— the brand ID that returned the errorstatus=…— the HTTP status code (5xx = Scrunch backend issue, 4xx = config/auth issue)body="…"— a short snippet of the API’s error responsefields="…"— the fields the chart asked for (in newer messages; helps identify high-cardinality timeouts)
FAQs
Can I use this with just one brand?Yes. Enter a single Brand ID and the connector works exactly like the older single-brand connector, with the added benefit of comparison fields, agent traffic support, and clearer error messages.Does Agent Traffic support weekly date grouping?
Yes. Use Date Week as the chart’s date dimension and the connector aggregates by week automatically. (Monthly is not supported by the Agent Traffic API yet.)
Are there limits to dashboard size?
Looker Studio allows a maximum of 30 concurrent Community Connector queries. Each chart counts as one query. Reports with more than ~15-20 Scrunch-powered charts may load slowly or hit the limit. If you need a large dashboard, consider splitting it across multiple report pages — Looker only loads the visible page.How do I compare last week vs. previous week?
Use Looker Studio’s built-in date comparison feature (in the date range control), or create a calculated field like:
Resetting your connector
If something goes wrong and you want to start fresh:1
Open Data Sources
Go to Looker Studio and click Data Sources in the top navigation.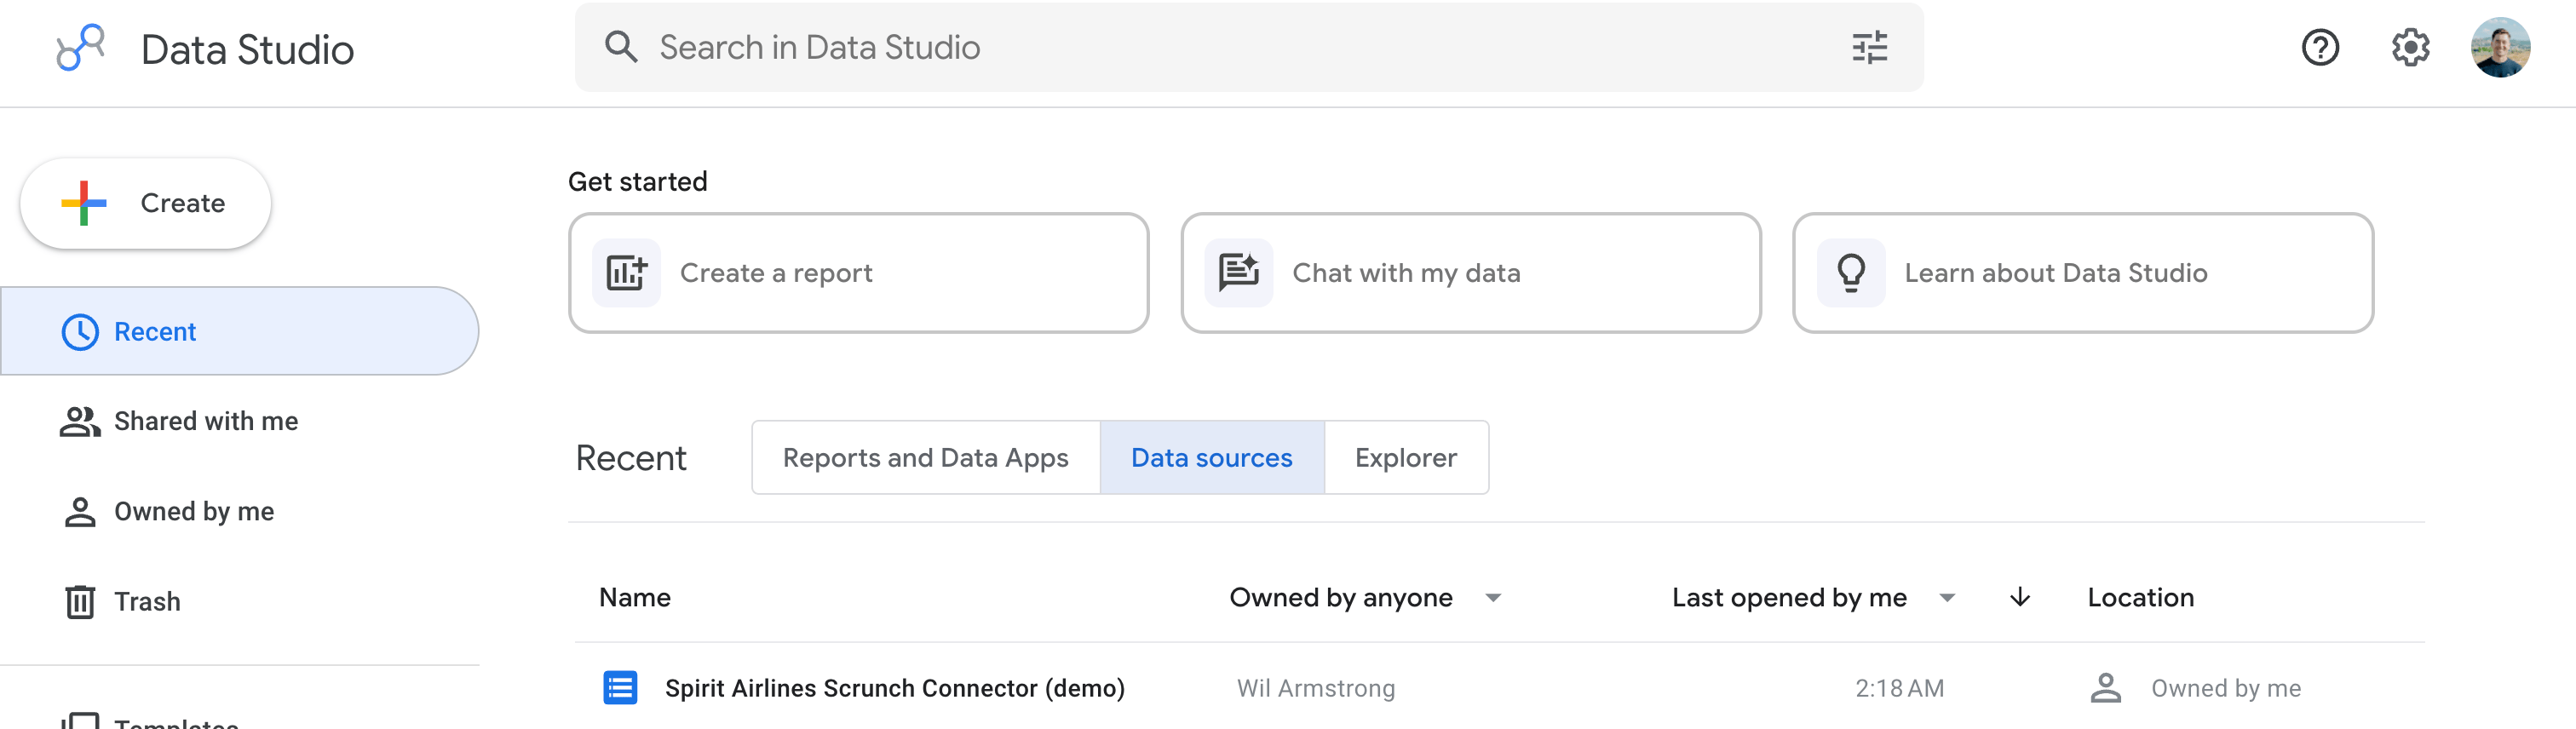
2
Remove the Scrunch data source
Find your Scrunch data source → click the three dots → Remove.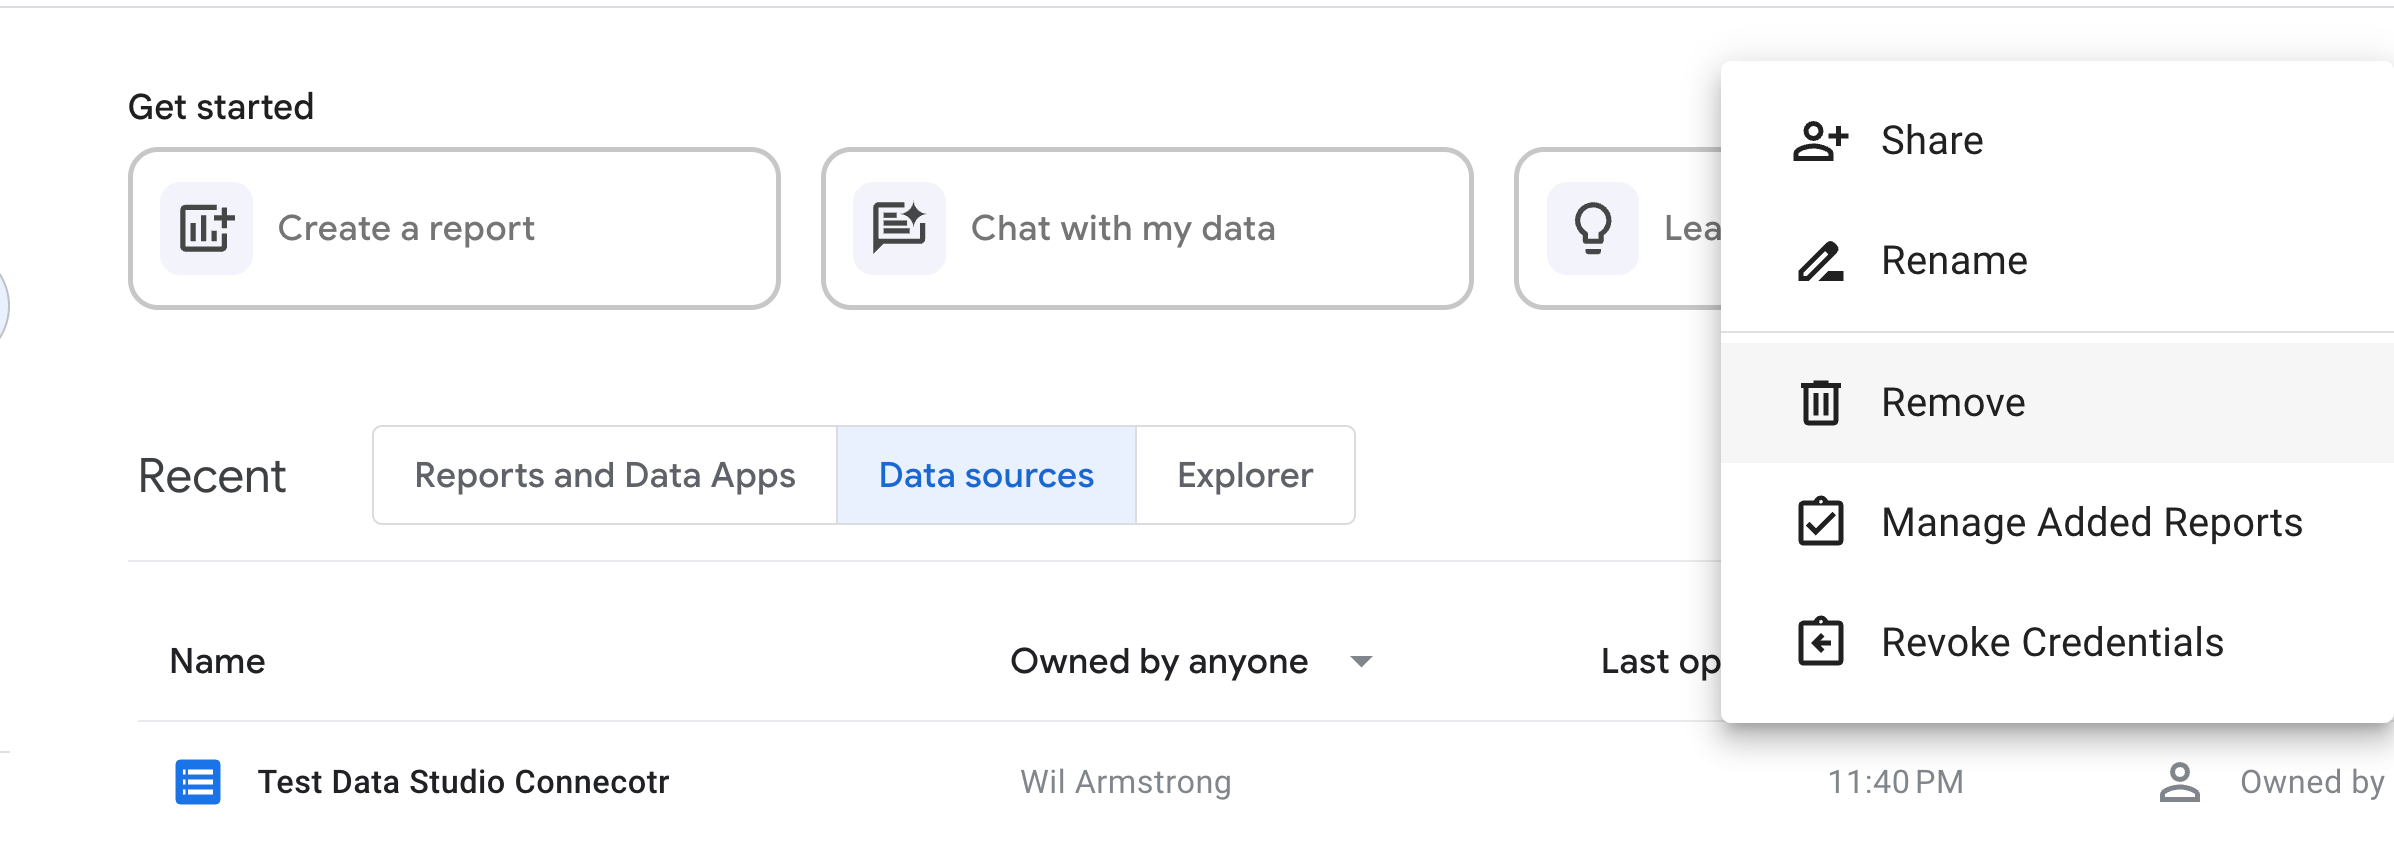
3
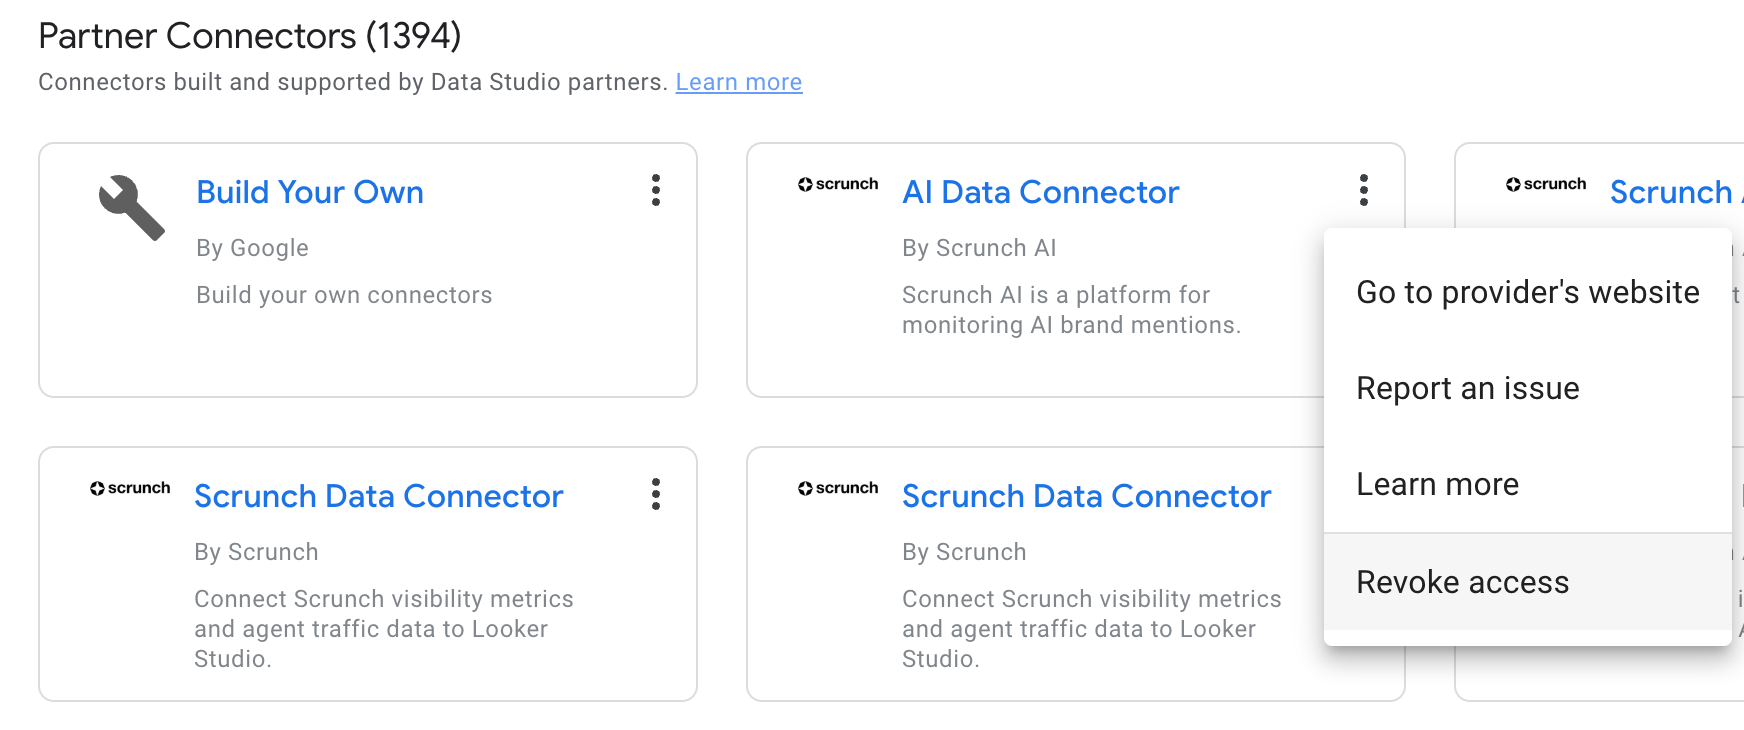
Revoke the connector
Click + Create → Data source → Scroll down to find the Scrunch connector under Partner Connectors → click the three dots → Revoke.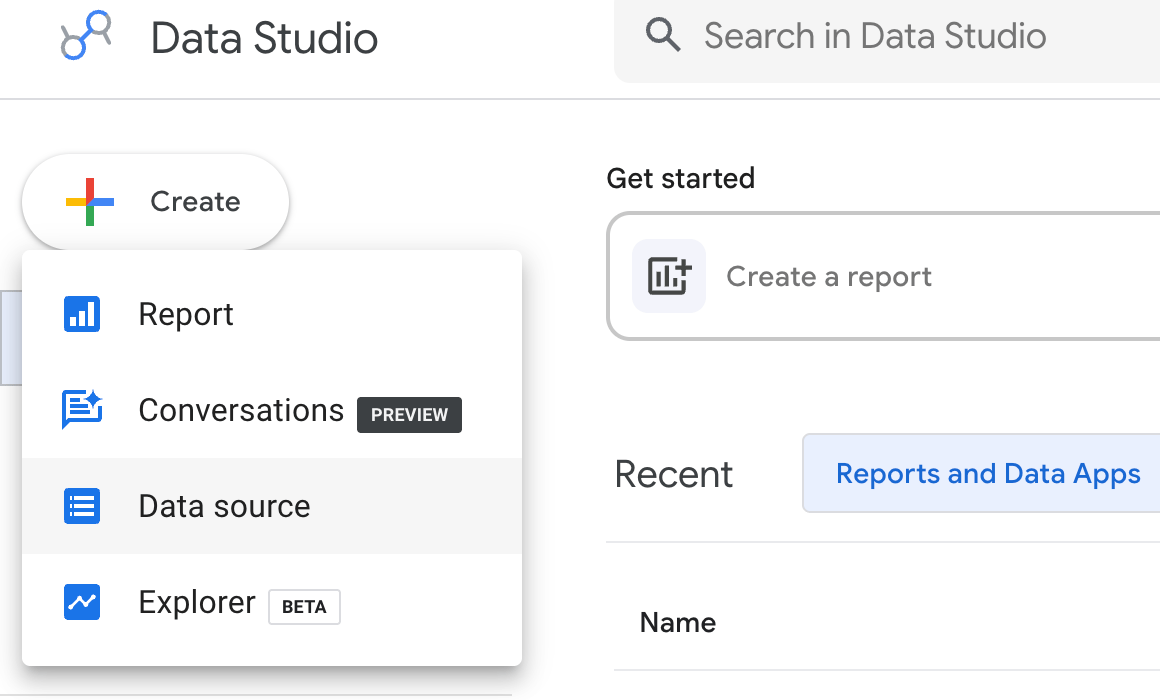
4
Reinstall
Use the connector install link to start fresh.