> ## Documentation Index
> Fetch the complete documentation index at: https://developers.scrunch.com/llms.txt
> Use this file to discover all available pages before exploring further.
# Looker Studio Legacy Single-Brand Connector
> Configure the legacy single-brand Scrunch Looker Studio Community Connector to build dashboards and blend brand visibility metrics with GA4 and other sources.
# Looker Studio Connector (Legacy)
This is the legacy single-brand connector. For multi-brand support, agent traffic data, and comparison fields, use the [Data Studio Connector](/integrations/data-studio-connector) (formerly Looker Studio v2)
Connect Scrunch to Google Looker Studio using our private Community Connector. This allows you to build dashboards, analyze historical performance, and blend Scrunch metrics with other data sources such as GA4.
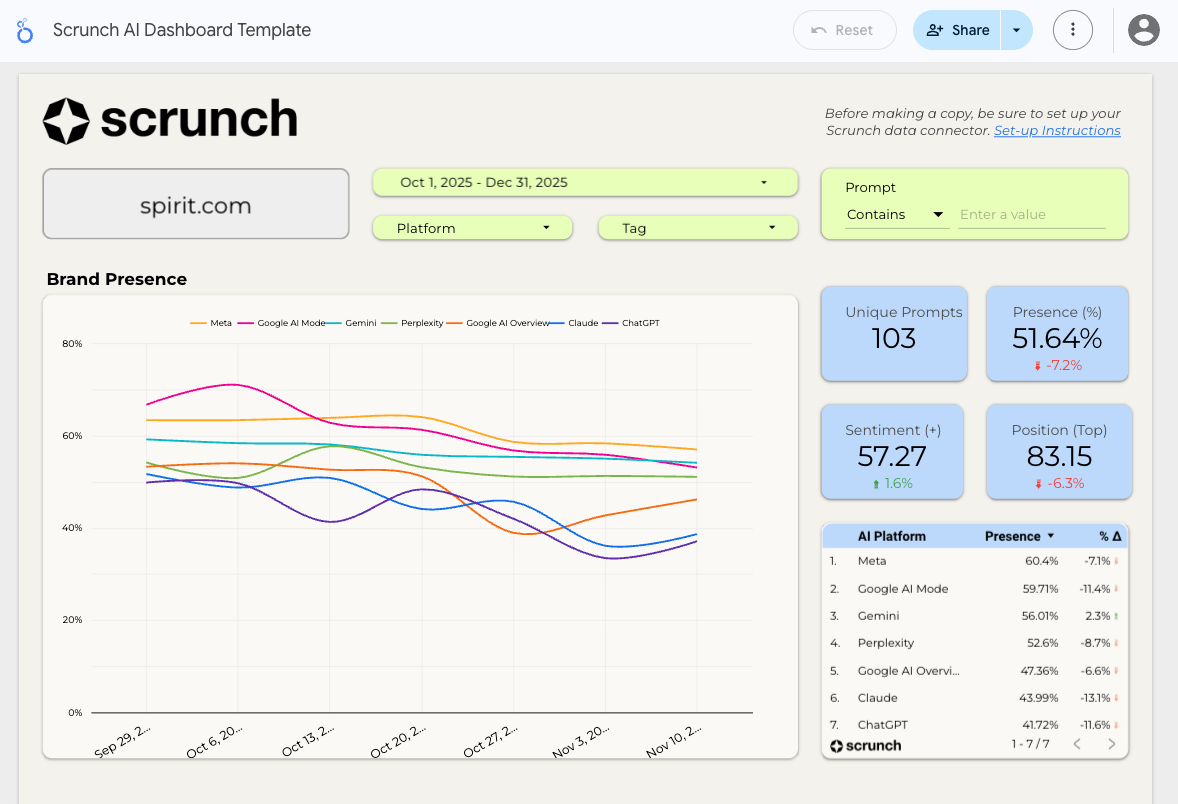 The connector exposes all standard Scrunch Query API fields, including:
* Brand presence, position, and sentiment
* Competitor presence metrics
* Date, platform, persona, tag, and source dimensions
Once connected, you can create fully custom dashboards or use our pre-built Scrunch Looker Studio template.
## Install the Scrunch Looker Studio Connector
The connector is not yet in the public gallery. Install it directly using the link below:
Open the Scrunch AI Looker Studio Connector
This installs the Scrunch AI data source inside Looker Studio for your Google account.
## Authenticate With Your Scrunch API Key
During setup, Looker Studio will prompt you for:
1. **Your API key**
> You can provision a Query-scoped API key from:
>
> **Scrunch** → **Organization** → **Settings** → **API Keys**
>
>
> A single API key may be scoped to one or many brands. Use narrow scoping when integrating with client-facing dashboards.
>
2. **Your Brand ID**
> The connector loads data for one brand at a time.
>
> To find your brand ID:
>
> Open the brand's dashboard in Scrunch
>
> Look at the URL:
>
> `https://app.scrunchai.com/org/.../b/1234/dashboard `
>
> Here, 1234 is your Brand ID.
>
>
> If you need multi-brand dashboards, reach out to Scrunch. We are collecting feedback for expanded multibrand support.
>
## Supported Dimensions and Metrics
### Dimensions
The connector aligns with the Scrunch Query API.
| Name | Data Type | Semantic Type | Notes |
| ---------------------------- | --------- | ---------------- | ------------------------------------------------------ |
| `prompt_id` | NUMBER | NUMBER | |
| `prompt` | STRING | TEXT | |
| `date_month` | STRING | YEAR\_MONTH | Last 90 days of data |
| `date_week` | STRING | YEAR\_WEEK | Last 90 days, keep filters week-aligned |
| `date` | STRING | YEAR\_MONTH\_DAY | Last 90 days of data |
| `source_url` | STRING | URL | |
| `source_type` | STRING | TEXT | Brand, Competitor, Other |
| `persona_id` | NUMBER | NUMBER | |
| `persona_name` | STRING | TEXT | |
| `competitor_id` | NUMBER | NUMBER | |
| `competitor_name` | STRING | TEXT | |
| `ai_platform` | STRING | TEXT | ChatGPT, Perplexity, Google AI Overviews, Meta, Claude |
| `ai_platform_search_enabled` | BOOLEAN | BOOLEAN | |
| `tag` | STRING | TEXT | |
| `branded` | BOOLEAN | BOOLEAN | Whether prompt includes brand name(s) |
### Metrics
| Name | Data Type | Semantic Type | Notes |
| -------------------------------- | --------- | ------------- | ----------------------------- |
| `responses` | NUMBER | NUMBER | Count |
| `brand_presence_percentage` | NUMBER | PERCENT | |
| `brand_position_score` | NUMBER | NUMBER | Range: 1–100 |
| `brand_sentiment_score` | NUMBER | NUMBER | Range: 1–100 |
| `competitor_presence_percentage` | NUMBER | PERCENT | Requires competitor dimension |
There is currently no singular metric that recreates the Scrunch `Competitive Benchmark `visualization. You may create side-by-side charts or blend data sources to approximate the view.
## Using the Scrunch Looker Studio Template
To accelerate setup and reporting, Scrunch provides a pre-built template.
Click the template link.
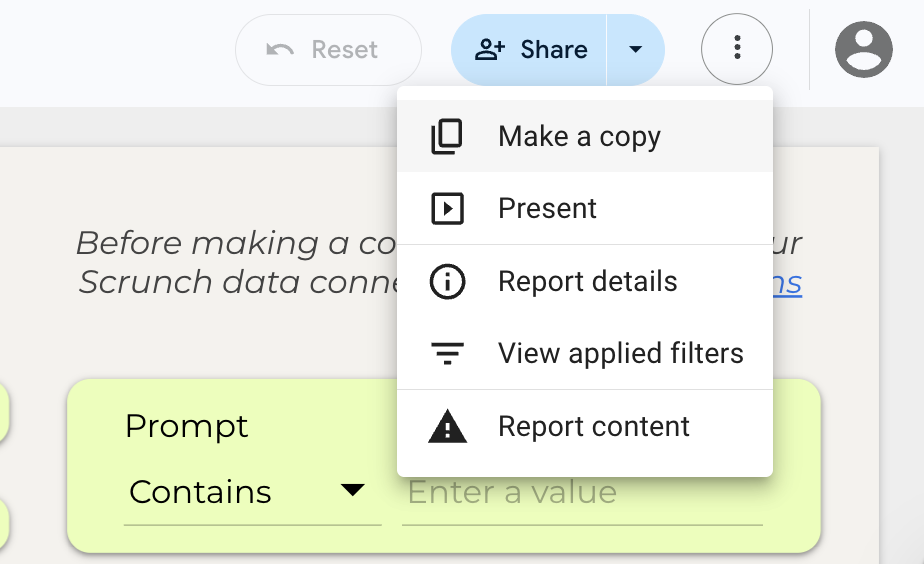
In the top-right corner, click the **three dots** → **Make a copy**.
Be sure to add install the [Scrunch Looker Studio Connector](https://lookerstudio.google.com/datasources/create?connectorId=AKfycbzRRK2rRqh1_ujHS313hitMb5PopzgNUS5m5ih6ohI) prior to copying.
The connector exposes all standard Scrunch Query API fields, including:
* Brand presence, position, and sentiment
* Competitor presence metrics
* Date, platform, persona, tag, and source dimensions
Once connected, you can create fully custom dashboards or use our pre-built Scrunch Looker Studio template.
## Install the Scrunch Looker Studio Connector
The connector is not yet in the public gallery. Install it directly using the link below:
Open the Scrunch AI Looker Studio Connector
This installs the Scrunch AI data source inside Looker Studio for your Google account.
## Authenticate With Your Scrunch API Key
During setup, Looker Studio will prompt you for:
1. **Your API key**
> You can provision a Query-scoped API key from:
>
> **Scrunch** → **Organization** → **Settings** → **API Keys**
>
>
> A single API key may be scoped to one or many brands. Use narrow scoping when integrating with client-facing dashboards.
>
2. **Your Brand ID**
> The connector loads data for one brand at a time.
>
> To find your brand ID:
>
> Open the brand's dashboard in Scrunch
>
> Look at the URL:
>
> `https://app.scrunchai.com/org/.../b/1234/dashboard `
>
> Here, 1234 is your Brand ID.
>
>
> If you need multi-brand dashboards, reach out to Scrunch. We are collecting feedback for expanded multibrand support.
>
## Supported Dimensions and Metrics
### Dimensions
The connector aligns with the Scrunch Query API.
| Name | Data Type | Semantic Type | Notes |
| ---------------------------- | --------- | ---------------- | ------------------------------------------------------ |
| `prompt_id` | NUMBER | NUMBER | |
| `prompt` | STRING | TEXT | |
| `date_month` | STRING | YEAR\_MONTH | Last 90 days of data |
| `date_week` | STRING | YEAR\_WEEK | Last 90 days, keep filters week-aligned |
| `date` | STRING | YEAR\_MONTH\_DAY | Last 90 days of data |
| `source_url` | STRING | URL | |
| `source_type` | STRING | TEXT | Brand, Competitor, Other |
| `persona_id` | NUMBER | NUMBER | |
| `persona_name` | STRING | TEXT | |
| `competitor_id` | NUMBER | NUMBER | |
| `competitor_name` | STRING | TEXT | |
| `ai_platform` | STRING | TEXT | ChatGPT, Perplexity, Google AI Overviews, Meta, Claude |
| `ai_platform_search_enabled` | BOOLEAN | BOOLEAN | |
| `tag` | STRING | TEXT | |
| `branded` | BOOLEAN | BOOLEAN | Whether prompt includes brand name(s) |
### Metrics
| Name | Data Type | Semantic Type | Notes |
| -------------------------------- | --------- | ------------- | ----------------------------- |
| `responses` | NUMBER | NUMBER | Count |
| `brand_presence_percentage` | NUMBER | PERCENT | |
| `brand_position_score` | NUMBER | NUMBER | Range: 1–100 |
| `brand_sentiment_score` | NUMBER | NUMBER | Range: 1–100 |
| `competitor_presence_percentage` | NUMBER | PERCENT | Requires competitor dimension |
There is currently no singular metric that recreates the Scrunch `Competitive Benchmark `visualization. You may create side-by-side charts or blend data sources to approximate the view.
## Using the Scrunch Looker Studio Template
To accelerate setup and reporting, Scrunch provides a pre-built template.
Click the template link.
In the top-right corner, click the **three dots** → **Make a copy**.
Be sure to add install the [Scrunch Looker Studio Connector](https://lookerstudio.google.com/datasources/create?connectorId=AKfycbzRRK2rRqh1_ujHS313hitMb5PopzgNUS5m5ih6ohI) prior to copying.
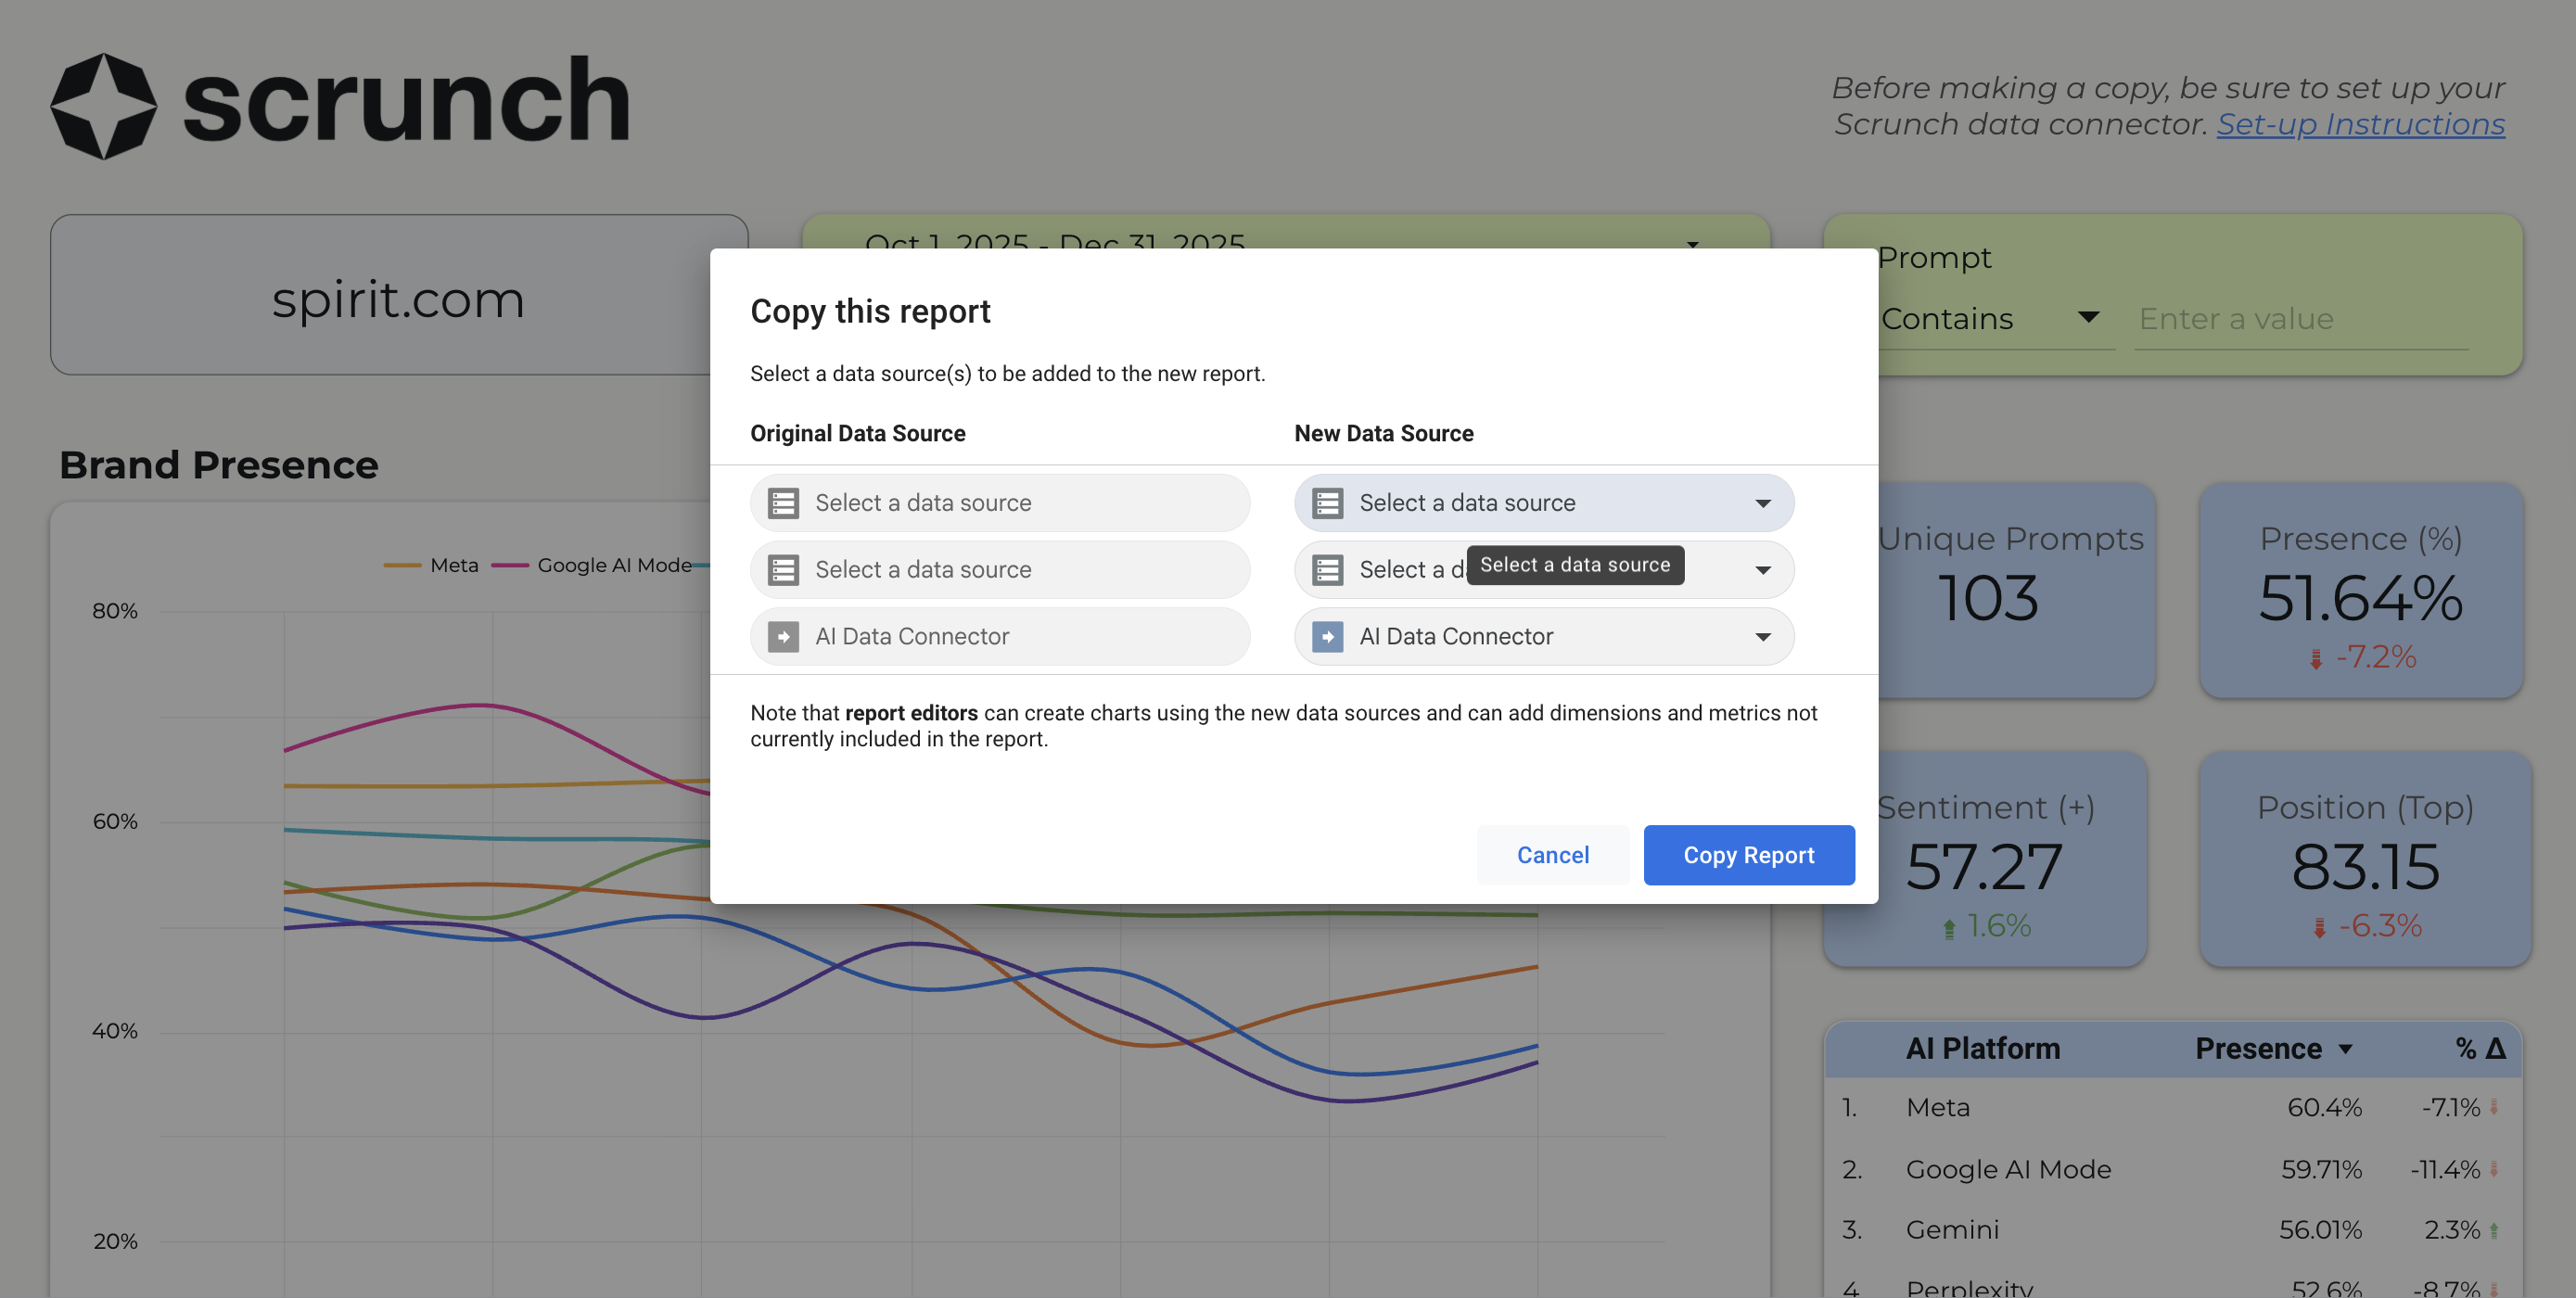
 When prompted, select the Scrunch AI Looker Studio connector you configured earlier.
 You can now modify charts, add filters, or blend additional sources like GA4, CRM data, paid media, and more.
## FAQs
**How do I compare last week vs. previous week?**
> Create custom metrics inside Looker Studio using conditional date filters. Example:
>
> * Last 7 days
> * Same 7 days previous period
> * Month-to-date vs prior month-to-date
>
> Looker Studio supports calculated fields using functions like:
>
> ```text theme={null}
> CASE
> WHEN DATE_DIFF(CURRENT_DATE(), date, DAY) < 7 THEN brand_presence_percentage
> END
> ```
**Are there limits to dashboard size?**
> Yes. Looker Studio allows a maximum of 30 concurrent Community Connector queries. Dashboards with more than \~15 Scrunch-powered charts may hit this limit depending on complexity.
**How do I recreate the Brand Presence + Competitor Presence chart from the Scrunch dashboard?**
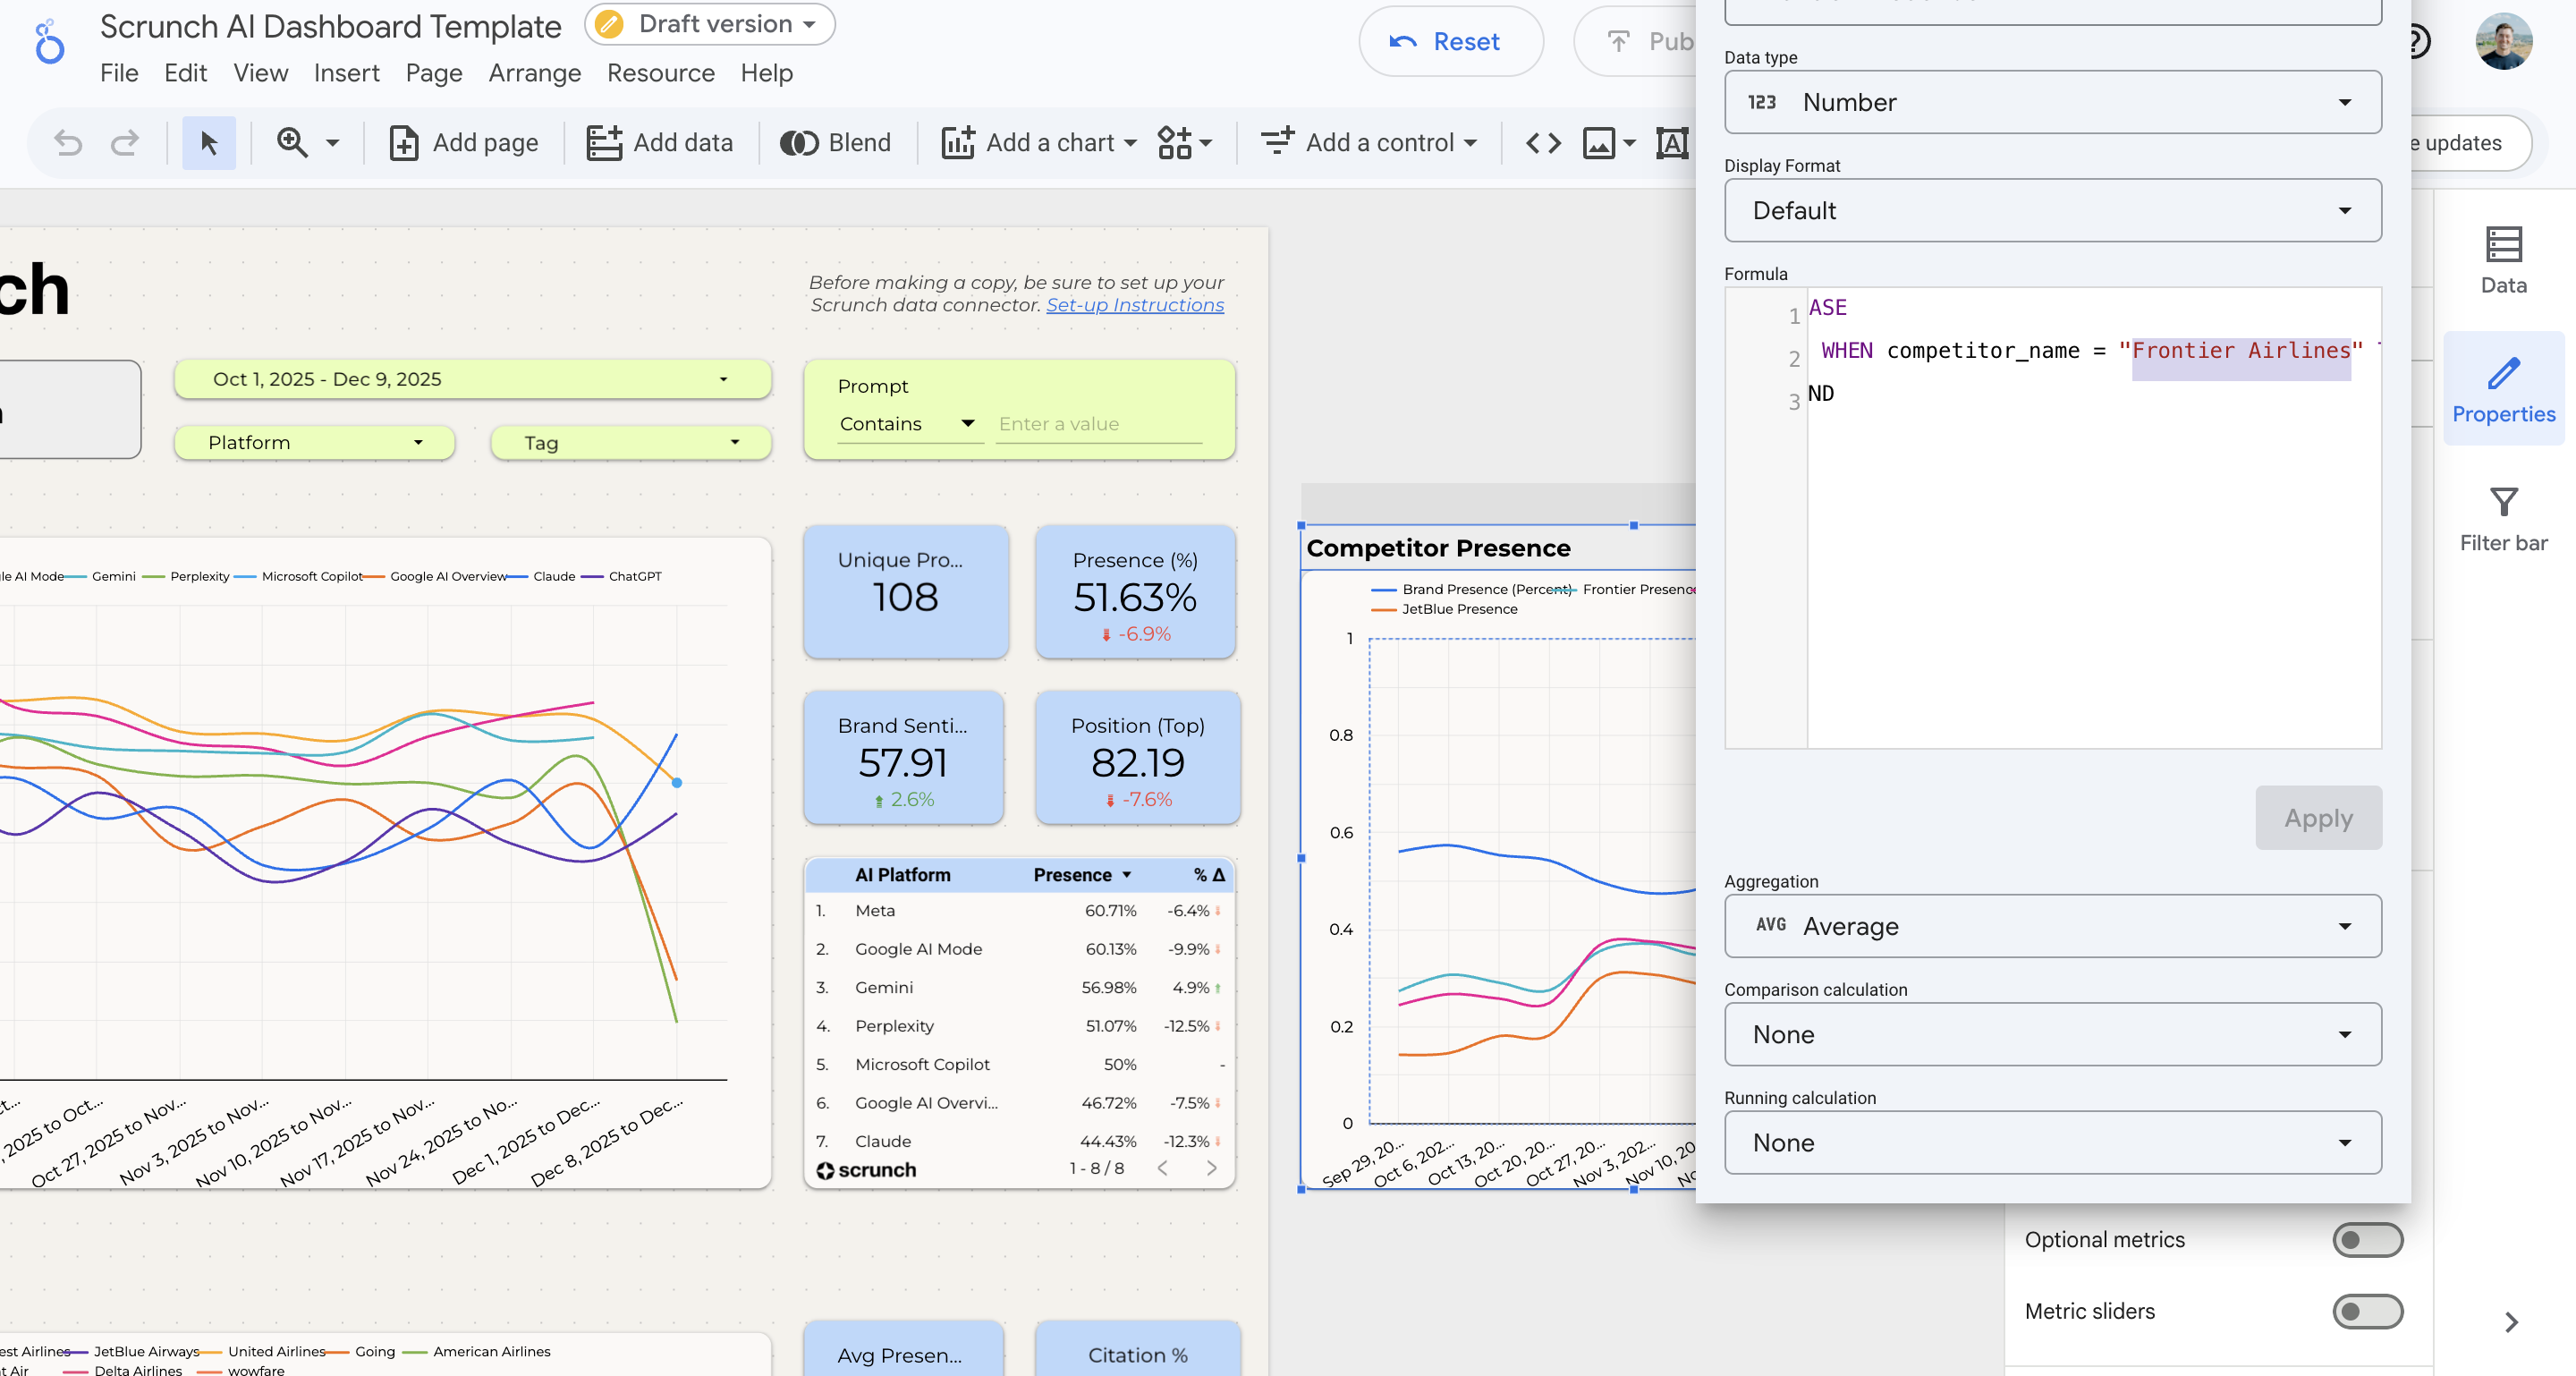
> A version of this combined view is already included in the Scrunch Looker Studio template. When you make a copy of the template, zoom out on the canvas—you’ll see a hidden chart that mimics the dual-line Brand vs. Competitor Presence visualization from the Scrunch dashboard.
>
> Looker Studio does not natively blend these metrics into a single field, so the chart requires custom-calculated metrics under the hood. Each competitor’s presence must be defined using a conditional formula, such as:
>
> ```text theme={null}
> CASE WHEN competitor_name = "Competitor A" THEN competitor_presence_percentage END
> ```
>
> **To customize the benchmark view for your own competitive set:**
>
> 1. Open the hidden chart in your copied template
> 2. Edit each metric formula
> 3. Replace the competitor names with the ones relevant to your brand
>
>
> There is no universal “competitive benchmark” metric available from the API. The Looker Studio template replicates this view by combining multiple calculated fields inside one chart.
>
>
>
You can now modify charts, add filters, or blend additional sources like GA4, CRM data, paid media, and more.
## FAQs
**How do I compare last week vs. previous week?**
> Create custom metrics inside Looker Studio using conditional date filters. Example:
>
> * Last 7 days
> * Same 7 days previous period
> * Month-to-date vs prior month-to-date
>
> Looker Studio supports calculated fields using functions like:
>
> ```text theme={null}
> CASE
> WHEN DATE_DIFF(CURRENT_DATE(), date, DAY) < 7 THEN brand_presence_percentage
> END
> ```
**Are there limits to dashboard size?**
> Yes. Looker Studio allows a maximum of 30 concurrent Community Connector queries. Dashboards with more than \~15 Scrunch-powered charts may hit this limit depending on complexity.
**How do I recreate the Brand Presence + Competitor Presence chart from the Scrunch dashboard?**
> A version of this combined view is already included in the Scrunch Looker Studio template. When you make a copy of the template, zoom out on the canvas—you’ll see a hidden chart that mimics the dual-line Brand vs. Competitor Presence visualization from the Scrunch dashboard.
>
> Looker Studio does not natively blend these metrics into a single field, so the chart requires custom-calculated metrics under the hood. Each competitor’s presence must be defined using a conditional formula, such as:
>
> ```text theme={null}
> CASE WHEN competitor_name = "Competitor A" THEN competitor_presence_percentage END
> ```
>
> **To customize the benchmark view for your own competitive set:**
>
> 1. Open the hidden chart in your copied template
> 2. Edit each metric formula
> 3. Replace the competitor names with the ones relevant to your brand
>
>
> There is no universal “competitive benchmark” metric available from the API. The Looker Studio template replicates this view by combining multiple calculated fields inside one chart.
>
>
>  ## Resetting Your Connector (If Needed)
If the connector was set up incorrectly, here's how to completely reset it:
Visit: [https://lookerstudio.google.com/navigation/reporting](https://lookerstudio.google.com/navigation/reporting)
Click Data Sources in the top navigation.
Find your Scrunch connector → ⋮ → Remove
## Resetting Your Connector (If Needed)
If the connector was set up incorrectly, here's how to completely reset it:
Visit: [https://lookerstudio.google.com/navigation/reporting](https://lookerstudio.google.com/navigation/reporting)
Click Data Sources in the top navigation.
Find your Scrunch connector → ⋮ → Remove 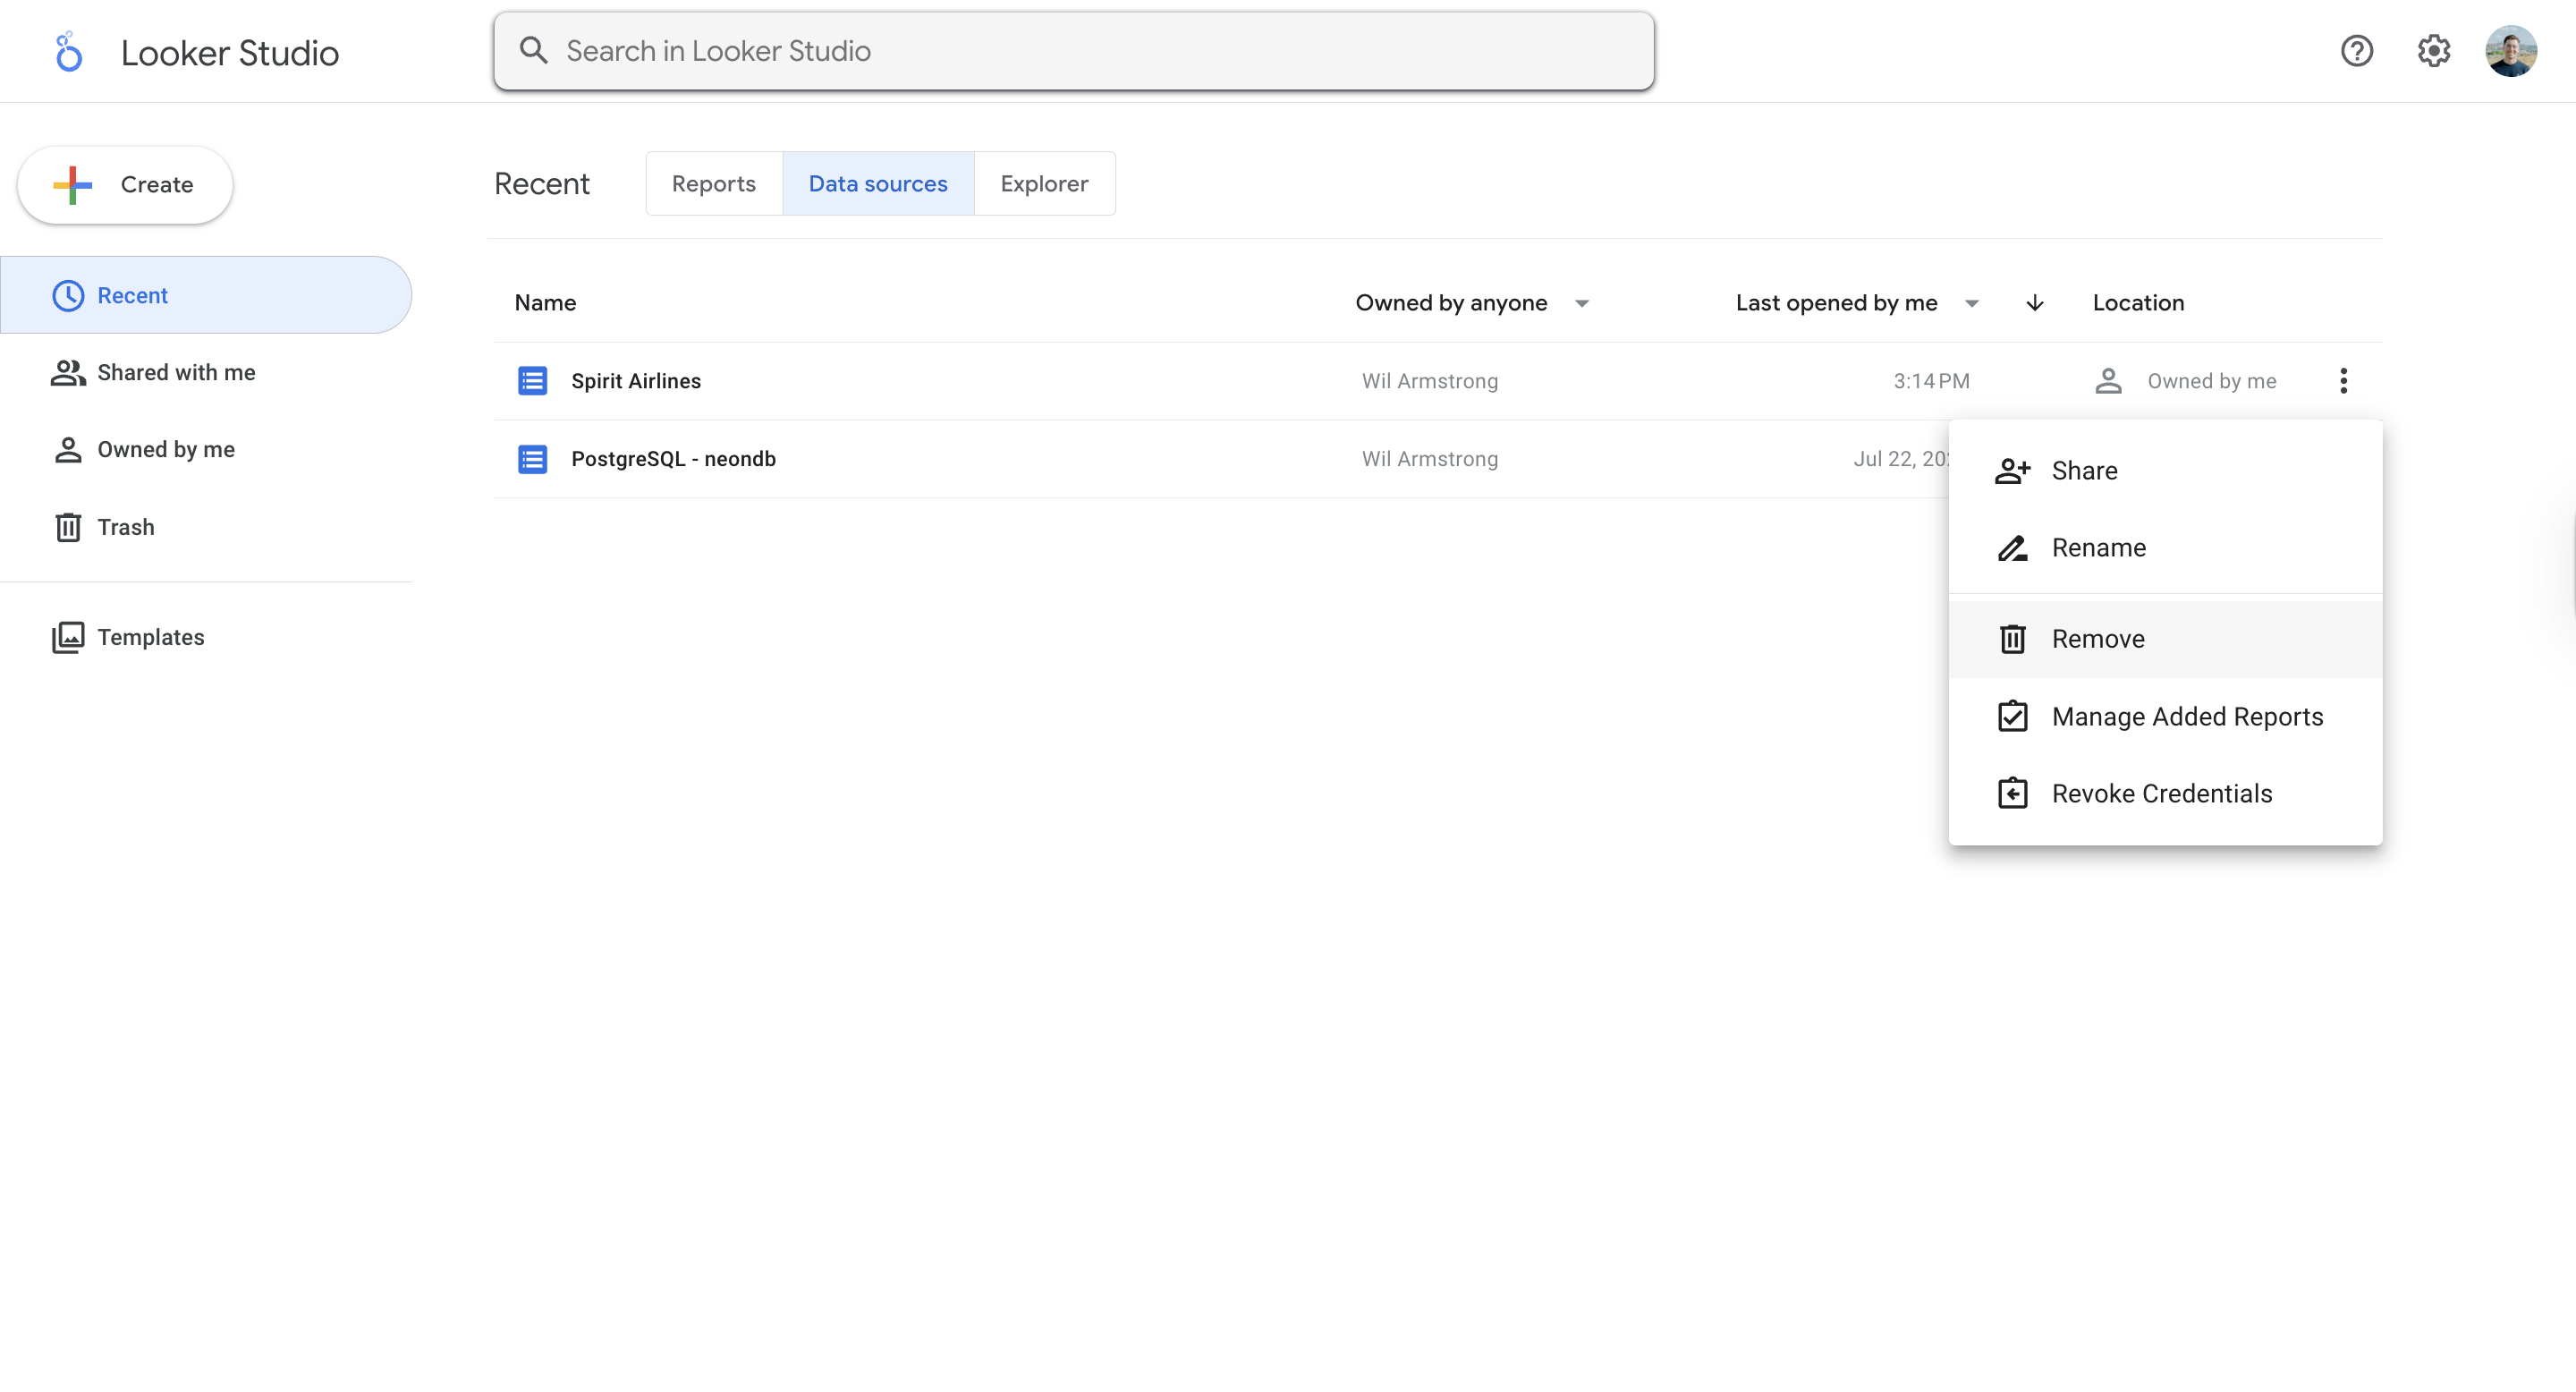 This could be named "**AI Data Connector**."
Click + Create → Data source → Partner Connectors → Scrunch AI Then ⋮ → Revoke
This could be named "**AI Data Connector**."
Click + Create → Data source → Partner Connectors → Scrunch AI Then ⋮ → Revoke 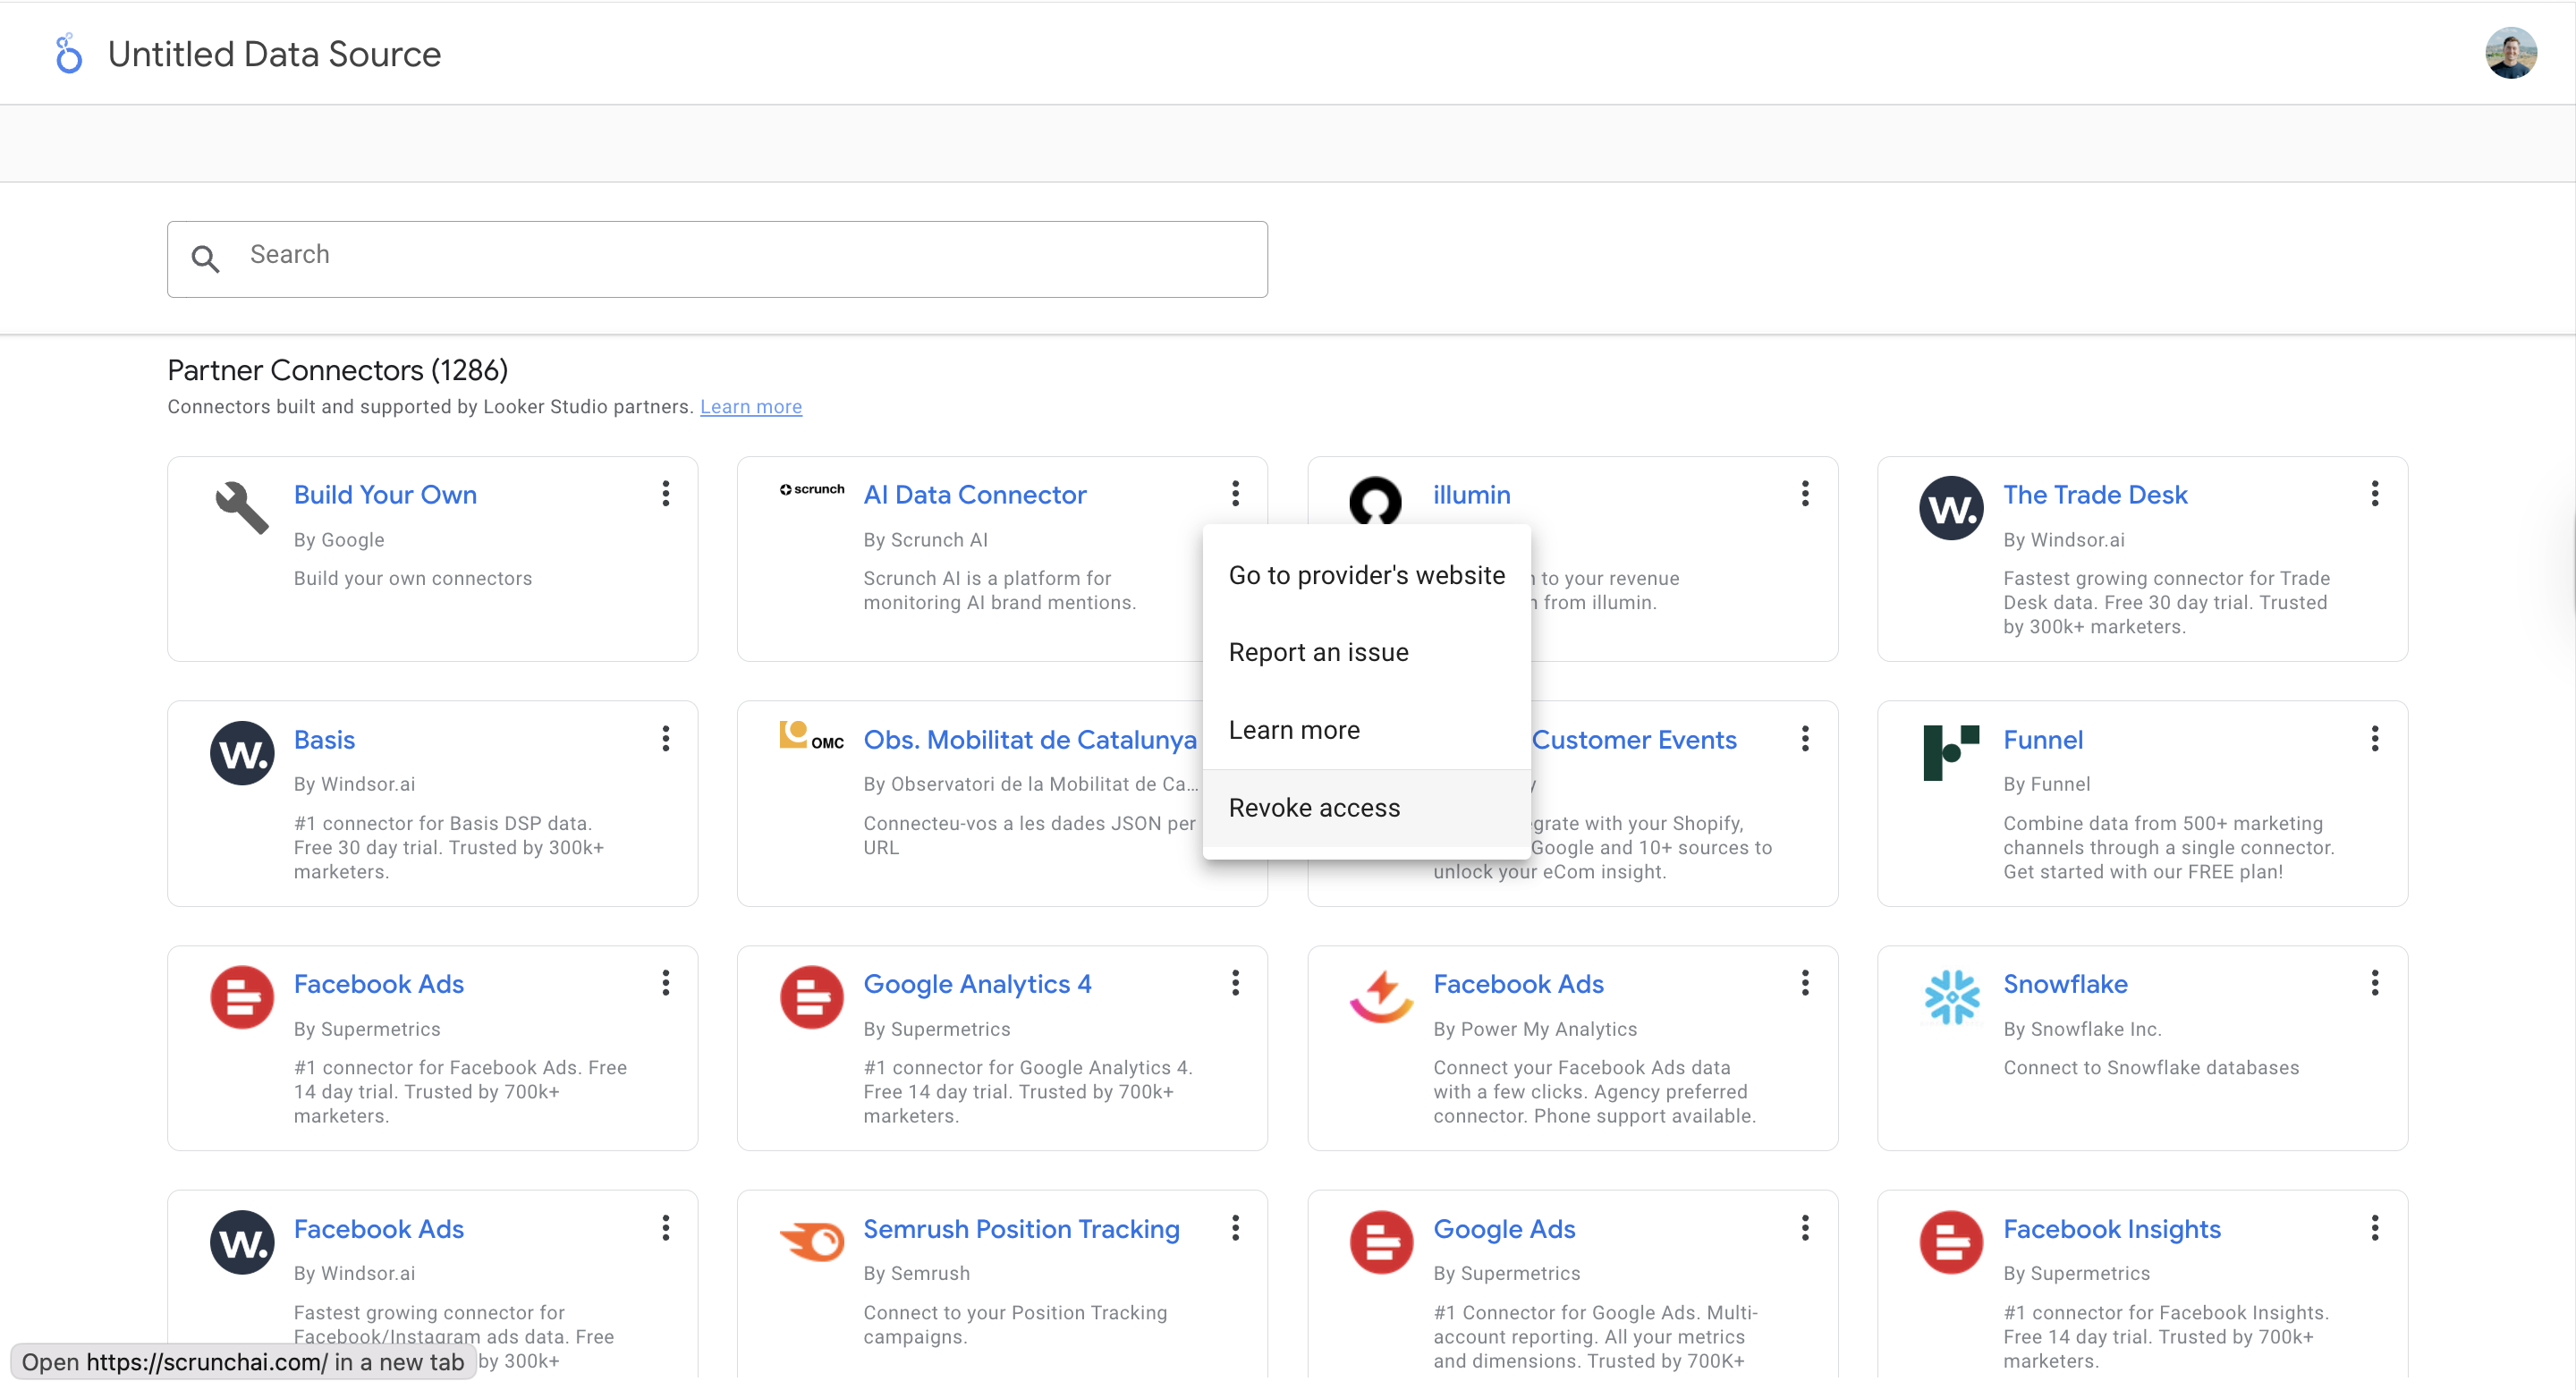 Use the connector link again: [https://lookerstudio.google.com/datasources/create?connectorId=AKfycbzRRK2rRqh1\_ujHS313hitMb5PopzgNUS5m5ih6ohI](https://lookerstudio.google.com/datasources/create?connectorId=AKfycbzRRK2rRqh1_ujHS313hitMb5PopzgNUS5m5ih6ohI)
You now have a clean state.
## Summary
Build dashboards for brand trends, sentiment, competitors, and platform performance.
Unify Scrunch visibility metrics with site traffic and conversion data.
Use our prebuilt Looker Studio template to jumpstart reporting.
Use the connector link again: [https://lookerstudio.google.com/datasources/create?connectorId=AKfycbzRRK2rRqh1\_ujHS313hitMb5PopzgNUS5m5ih6ohI](https://lookerstudio.google.com/datasources/create?connectorId=AKfycbzRRK2rRqh1_ujHS313hitMb5PopzgNUS5m5ih6ohI)
You now have a clean state.
## Summary
Build dashboards for brand trends, sentiment, competitors, and platform performance.
Unify Scrunch visibility metrics with site traffic and conversion data.
Use our prebuilt Looker Studio template to jumpstart reporting.