> ## Documentation Index
> Fetch the complete documentation index at: https://developers.scrunch.com/llms.txt
> Use this file to discover all available pages before exploring further.
# Data Studio Dashboard Templates for Scrunch
> Copy pre-built Looker Studio dashboards for multi-brand visibility, single-brand performance, and AI agent traffic and connect them to your Scrunch data.
# Dashboard Templates
Choose a pre-built template to get started quickly. Make a copy and connect it to your Scrunch data source.
Multi-brand visibility overview with presence, position, and sentiment.
Deep dive into a single brand's visibility, sentiment, and competitive performance.
See which AI bots are crawling your site, how often, and which pages they target.
Measure human referral traffic to your site from AI sources like chatgpt.com and perplexity.ai.
## How to Use a Template
Make sure you've already installed and configured the v2 connector. See the [Data Connector](/integrations/data-studio-connector) guide.
Select a template from the gallery above and open it.
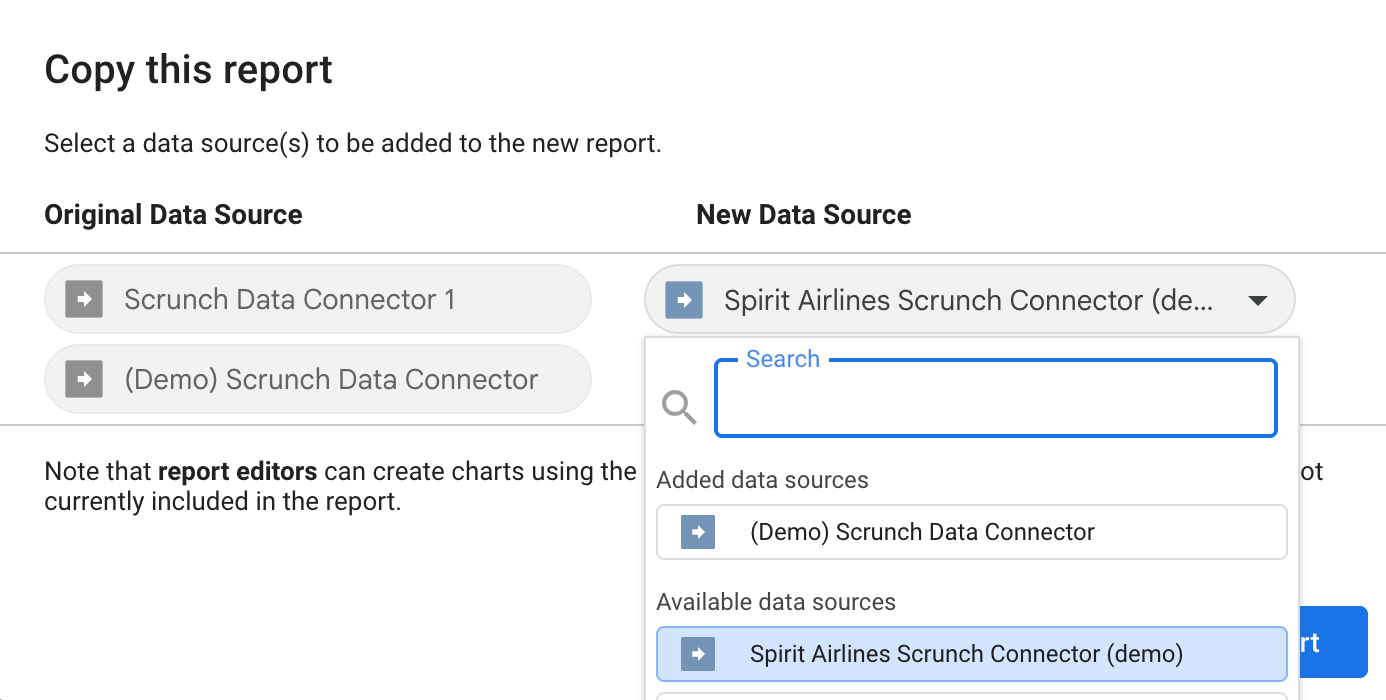
In the top-right corner, click the **three dots** → **Make a copy**.
When prompted, select the Scrunch data source you configured earlier.
 You can now modify charts, add filters, or blend additional data sources like GA4, CRM data, or paid media.
